Cole Pham's Posts (6)
Sort by
The Australian housing bubble is looking to be a bigger problem for that country than the U.S.' was in 2008-09. Australia differs from the U.S. both in terms of relative economic conditions and the health of its property markets. The mountain of debt is Australia is mostly private - housing - and dwarfs public-sector debt.
Australians have gone heavily into debt to buy houses that cost more than ever, especially the land component; and there's no sign this trend will end anytime soon. Mortgage debt has more than quadrupled from 19% of GDP in 1990 to 84% in 2012-- as high as that of the U.S. at its peak where mortgage debt as a percentage of GDP has fallen from 86% in 2009 to 68% in 2012. Negative gearing and easy lending combined to push house prices higher. Looking at affordability as a function of disposable income, both the ratio of total debt and interest payments to disposable income are very high - see the chart below. Widespread mortgage fraud to gain bank credit is asserted by Denise Brailey, the president of the Banking and Finance Consumer Support Association (an organization dedicated to protecting the public against predatory financiers).

(Click to enlarge)
The government's privatized and deregulated retirement system is the leading cause. Do-it-yourself superannuation funds - a kind of government-mandated retirement account replete with 401K-style matching -- enter this market and avoid capital gains tax, which has created an enormous pool of available loan capital. The Reserve Bank of Australia (The RBA) cut rates this May to push the housing market further, after a February to March rise by 5.2% in loans to owner-occupiers, according to new bureau of statistics figures.
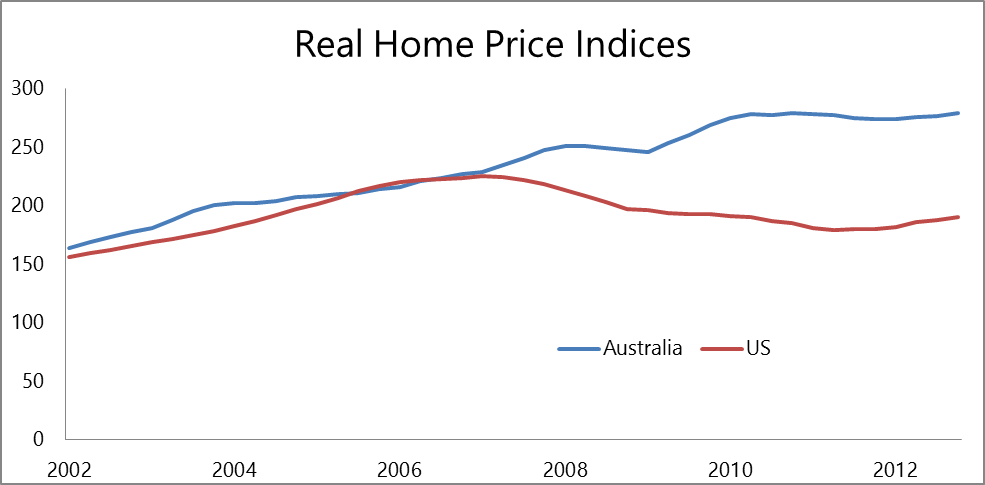
The high capital gains tax system helps to feed this by people holding onto their houses as opposed to selling them. Worse, the return after paying capital gains tax is less than the return on rent for investment houses, which further reduces supply and puts upward pressure on prices. Contrary to the U.S.' sharp fall in home prices after the peak in June 2007, Australia's has kept climbing up to an index (1986 starting point) of 279.2 at the end of 2012. It is forecasted at 3-5% growth nationally, 2-8% growth for Sydney.
(Click to enlarge)
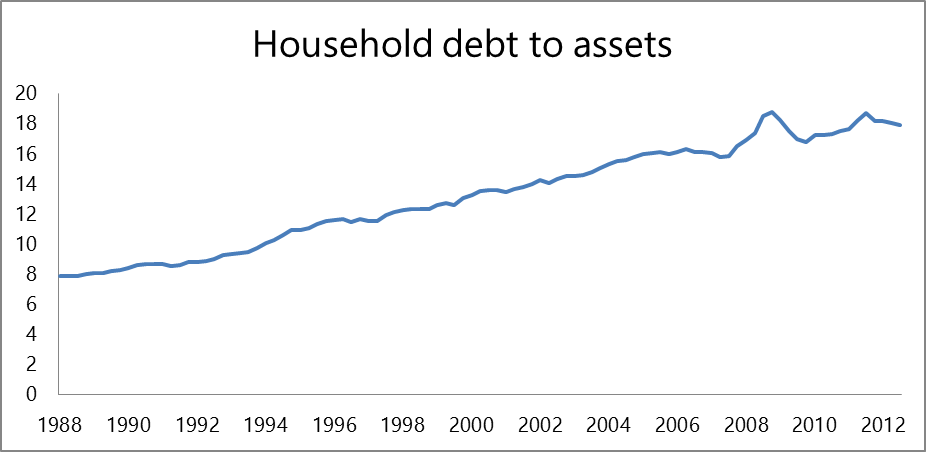
Dr. Ellis of the Reserve Bank of Australia warned that lowering financing standards to boost loan growth has lead to massive negative equity in the market. Besides, much of this lending has been financed from abroad, so the key risk is in the banks' ability to refinance their borrowings. Australia's household debt to household assets rose to 18% at the end of last year. Under the disaster scenario, with banks trying to repay foreign creditors and a decline in economic growth, Australia's banks and housing sectors would be very hard hit.
Figure 3
(Click to enlarge)
Australia's economy is experiencing increasing reliance on overseas funding, becoming more interlinked with China's growth and business cycle. The Chinese economy grew at 7.8% GDP in 2012, the slowest since 1999, and an increase in global commodity supplies could cause a sharp reduction in Australia's incomes and employment. Australia linked up with China in direct currency trading in March and this puts the country in a tenuous position if trade between the two countries slowed dramatically and would prompt a severe correction of home prices which some feel could take price all the way back to the 1990's.
Why would this be a real problem? Because much of the immigration into Australia recently has been Chinese. Chinese property buyers are choosing Australia in increasing numbers, and their decision is not driven by rental yields or hopes for future capital gains. For Chinese buyers it's not only about price. Australia is the second most favored destination for Chinese buyers of overseas property because many want their children educated in Australia, fleeing the Chinese public and university systems. It has caused some of the recent overpricing in Australia's housing market, which has continued well beyond what economists feel is the equilibrium price for dwellings - by 30% to 40%
So, it is very possible that if the current softness in the global economy continues to deteriorate, and that is a very likely occurrence, then Australia's property bubble will burst, having a huge affect on Australian ETFs. MSCI Australia Index Fund Holding (EWA), with 42% exposure to financial services and 6.9% in real estate sector, will keep growing as long as the global equity rally continues. It currently pays investors a 4.97% dividend yield, which compares favorably to the 2.41% of the Vanguard REIT ETF (VNQ). Australian REITs, after their second-best year on record, will continue to be strong through 2013 through M&A activity and divesting themselves of overseas assets. The S&P/ASX REIT Index had its largest outperformance on record in 2012 with a total return of 33% in 2012 and is predicted to gain 15% this year, according to CLSA's forecast.
The rate cut by the RBA was widely believed to be done to support flailing mining and commodity sectors, but it is much more likely that it was due to the need to keep pumping up the housing market and alleviate the rising cash flow problems of the average Aussie wage-earner. The move in the Australian Dollar (FXA) has likely been way overdone and but with it unable to even regain $0.97 the short-term looks bearish. A turn in the Australian dollar would begin to signal that the market does not believe the Fed will back off QE in 2013. But, if that does not happen and the Fed attempts to defend the dollar at all costs look out below down under.
The U.S. dollar is losing its status as the world's reserve currency. It's not happening all at once, but slowly and methodically as the dollar is used to settle international trade less and less. The Federal Reserve continues to rig the markets to foster weakness in gold (GLD) prices through a combination of continued ETF outflows and upheaval in the foreign exchange markets created by the debasement of the Japanese Yen (FXY) to support the notion of a strong dollar. This has sparked tremendous short activity in the futures markets and simultaneous unprecedented demand in the physical market. This has eroded the conviction for holding securitized gold and has given cover to economists' forecast for an acceleration in U.S growth later this year.
If gold isn't rising there is no inflation. Gold isn't rising in response to QE. That has been the bearish argument all year. And since the futures market sets the price - or more accurately, has always set the price - bear arguments for gold that defy logic because of the data. But that is changing and we believe the change will begin to occur rapidly the longer the futures price stays near current levels.
The change will come as the physical market becomes the market that sets the price while the futures market crashes.
The Federal Reserve's policy of printing $1 trillion annually in order to support the impaired balanced sheets of banks and to finance the federal deficit was challenged by a steadily rising gold price. Since the beginning of the program the Fed's spokespeople have been talking about ending it. This is simple propaganda and disinformation. As we showed in a previous article the Fed has been accelerating the growth of total credit it is issuing which comes from the expansion of the monetary base and, by proxy, the Fed's balance sheet. In other words QE on a monthly basis has been accelerating, not tapering off. So, listening to the Fed governors tell us that it will back off of QE should be met with more of a "Show Me" attitude than it has.
Global gold demand in the first quarter of 2013 fell by 18% to 932 tons compared to last quarter of 2012. However, the world is witnessing aggressive buying physical gold with a 12.8% increase in demand for jewelry, bars and coins. In Asia, gold is a revered asset class which has helped preserve the wealth of generations who remember all too well hyperinflation and war. U.S export data for December showed an exodus of privately owned gold from the United States into emerging economic powers, such as China, India and Hong Kong which can be attributed to the growing number of gold vaults and new precious metals investment products available.
The continued discount between the GLD and the futures price of gold still points to erosion of the quality of the assets backing the GLD and if it widens, we'll know that the trust does not actually have the gold it says it has.
(click to enlarge)
Gold demand in China jumped to a record in the first quarter as sentiment regarding the country's economy underpinned consumption during the Lunar New Year coupled with prices breaking back below $1,700 per ounce. Consumption reached 294.3 tons in the first three months, up 20% from a year earlier, accounting for 26.7% global demand. The appreciating Yuan (CYB) has helped Chinese demand as well, trading currently at ¥6.134, an all-time high. Chinese investors, discouraged by the weak domestic stock market, increasingly relied on gold to fulfill their investment needs.
Similarly, gold demand in India, the world's largest consumer, rose by 27% to 256.5 tons in the first quarter, despite the government's desperate attempts to place curbs and roadblocks on gold importation. Frankly, Indians do not care about these things and as we get deeper in the year and closer to the wedding season, physical demand is only going to rise. This will only continue to fuel a black market in gold imports and raise the premiums paid. In particular, total jewelry demand rose by 15% to 169.5 tons from 138.3 tons, while investment demand increased by 53% to 97 tons.
But, the price of gold is not set by raw demand numbers, it is set more by the expectation of future demand and right now those expectations are at all-time highs. So, why is the price under pressure? Because the monetary system needs it to be dropping. A rising gold price destroys the status quo and calls into question the efficacy of policy. Prices do not fall when demand is rising naturally. Demand only rises like we have seen when prices are being made to move artificially away from equilibrium.
Simply put, the current gold market structure looks exactly like a price ceiling mismatch from a first semester economics class. And like all government-imposed price ceilings the ends are argued to justify the means. The ends in this case is the illusion of economic stability and soundness of the valuation of most financial assets and the means is the suppression of the price of gold.
Here's some more data. Vietnam bought some $4.4 billion worth of foreign currencies, mostly US dollars to import about 100 tons of gold bars which still can't keep up with demand. Imports were up 700% in Q1 according to the Minister of Industry and Trade. We are seeing 20% premiums here now, significantly higher than the 7-11% seen in earlier months. Premiums for gold bars also rallied to all-time highs in Hong Kong and Singapore on May 16. Hong Kong fetched premiums of up-to $5 an ounce over spot London prices while Singapore's were lifted to $3.5 an ounce. Central banks of Russia, South Korea, Kazakhstan and Azerbaijan continue to buy gold to add to their reserves.
The disconnect between physical gold and paper gold gets greater. The first quarter saw ETF outflows equating to a 7% decline in total AUM. The speculation is that a number of shareholders moved to redeem shares for physical metal while other rumors have the gold flowing to the NY vault of JPMorgan (JPM) to prop up its eligible reserves on the COMEX. Money managers, including hedge funds, pulled $1.4 billion from the US gold futures market for the week ended May 14 by trimming their net long position in the metal.
But the over-riding question is where did the gold go? It's not in the vaults at the COMEX which are at historic lows. More than 300 tons have flowed out of GLD but more than three times that amount has been imported by China. The U.S. exported more than three times the amount of gold it mined in Q1. Do you not think that the COMEX gold was a part of that? Or do you think it's sitting around waiting to be bought?
A great number of countries look at moving away from the dollar not only include BRICS but also Japan, Australia and most of Southeast Asia -Thailand and the aforementioned Vietnam. Strong outflows and foreign demand will reach their limit and the current policy of managing the dollar's declining role through gold suppression will end. Sitting out there is the yuan and the latest update to China's gold reserves, which will be revealed to the world when it is most damaging to the U.S. Dollar, especially if the current policy to isolate the yuan as the only appreciating currency versus the dollar goes too far. All China has to do is declare that they have 3,000 or 4,000 tons of gold backing the yuan and the entire market changes overnight. For now China is content to catch gold bars falling from the COMEX and LBMA at fire sale prices. Investors should fortify their portfolios accordingly.
A number of past financial crises have had their roots in countries pegging their currency to the U.S. dollar. The Thai baht was at the epicenter of the Asian Crisis of 1997/98. Argentina's hyperinflation of 2001/2 was also caused by a disastrous currency peg. Today there is not much left of that policy, but there are two notable exceptions and they are two of the most important currencies in Southeast Asia, the Singapore dollar (FXSG) and the Hong Kong dollar.
While their pegs are different in nature, both countries' central banks tie their economies to that of the U.S.' at a fundamental level. And if there is change in the structure of U.S. interest or exchange rates then this will have large effects on these two important Asian economies.
U.S. bond yields have been steadily rising since July 2012, this includes during QE IV of this year. While 10 year bond yields (IEF) struggled to push past 2% that level is behind U.S. now, and we could be entering a new higher yield period. We've moved past the worst of the fear over Cyprus and bond traders are now calling the Fed's bluff on tapering QE. But since the situation in Cyprus has been resolved and the Bank of Japan has actually begun printing versus the verbal deprecations that occurred in December, U.S. Treasury yields have begun rising again, taking Hong Kong and, finally Singaporean rates with them (note the lag in SG 10 year yield rise on the chart above).
Singapore doesn't have an overt interest rate policy. Instead, Singapore allows interest rates to be influenced indirectly by the interest rates of the basket of currencies by which the MAS manages the SGD exchange rate. If bond yields had not started rising with U.S. Treasuries that would have been telling.
Initially, the Singdollar weakened as U.S. Treasury yields rose. We suspect that the MAS was looking to support exporters somewhat as Singapore struggles with low export growth to both the U.S. and China. With the yuan (CYB) trading at an all-time high versus both the SGD and the USD this would have been a good opportunity to reset the exchange rate a bit, before letting yields rise.
The rapid rise of the Hong Kong 10 year yield should be worrying considering the size of the property bubble that has formed there. Some rise in yield is likely desired at this point but too much too fast could be dangerous to the interbank market.
With QEIII being essentially open-ended, the Hong Kong Monetary Authority is obliged to intervene when the local currency hits the upper or lower limit of the trading band. This is important for Hong Kong as it forces local interest rates to follow the U.S.' while its economy may be completely out of sync with the American one. Mainland economic policy must manage inflation risks due to the appreciation of the yuan against the dollar. This will manifest in core CPI -- food and energy prices -- rising.
Why this is important is that Hong Kong and Singapore both are important cogs in China's drive to remove USD as the world's trade settlement and dominant reserve currency and replace it with the yuan. Almost daily there is another report of some small cut being sustained by the dollar in international trade -- the latest is the issuance of $245 miillion in yuan-denominated bonds in Singapore by Stanadard Chartered and HSBC (HBC). While the Fed uses the blunt instrument of monetary policy to thrash global money flows from stem to stern, the rest of the world quietly goes about the business of marginalizing it at a policy level.
China has signed more than 30 bilateral trade agreements with countries around the world and the latest news has them negotiating with both France and New Zealand. Iran has been accepting payments for its oil in gold, smuggled through Turkey. yuan-denominated commodities trading is taking shape around the region - iron ore copper, gold, silver and soon crude oil futures, all trade in Shanghai now.
Since the global financial crisis, countries like Singapore, Hong Kong and other Asia nations have been prepared to take steps to mitigate the risk of a U.S. dollar collapse. The Chiang Mai agreement between the ASEAN+3 nations - the 10 ASEAN countries plus China, Korea, Taiwan - was doubled last year to $240 billion dollars to buffer the region against dislocations in the currency markets.
We see the advent of a new currency order on the horizon with three distinct blocs of more or less equal size: the dollar bloc, a yuan/BRICS bloc and the euro (FXE). Because of this the current monetary regimes of Singapore and Hong Kong will have to be dismantled and realigned regionally. Whether the dominant currency becomes the yuan itself or one of these two trading and financial hubs remains to be seen. Everything seems to point to the fact that the Chinese want reserve currency status for the yuan, therefore that is the dominant bet.
That said, Hong Kong announced recently that it has no plans to change its currency peg against the U.S. dollar. If Hong Kong was to review the Hong Kong dollar peg, it could do worse than modeling Singapore's mananged float, rather than choosing either a complete free float or pegging it to another currency. There are still some who are concerned that China will not dismantle its capital account controls but that seems remote given the number of moves to open up the yuan, deepen the liquidity pool flowing through Hong Kong and easing the use of it overseas.
At some point both Hong Kong and Singapore will have to shift their monetary regimes to align more with the yuan than with the dollar. Inter-ASEAN trade in 2011 was still just 25% of total regional trade while China, Japan and South Korea accounted for 28.3%.
The U.S. and the EU combined only accounted for 18.1% and this is where the rub is. As we approach the Asian Economic Community these trade percentages will continue to skew regionally away from the U.S. and Europe and closer to home. And with that capital flows will continue to change and the need for the dollar locally will drop. We already have an emerging yuan bloc replacing the dollar in a practical sense. It only follows that monetary policy will eventually follow suit.
Vietnam's central bank cut interest rates again last week as inflation slowed, joining central banks from Sri Lanka and Australia to the ECB in easing monetary policy. It is seeking to spur lending and boost consumption after having to rein in a credit boom that has slowed economic growth to a 13-year low. But with the announcement that the Prime Minister's office had given its approval for the creation of the Vietnam Asset Management Company - a Vietnamese version of the Resolution Trust Co. used in U.S. liquidations - it may be that the country is getting serious about cleaning up the balance sheets of its biggest and weakest banks.
The effectiveness of the VAMC will be limited by the size of the company. We've heard reports of a paltry $24 million as the initial chartered capital. If that is the case then this is more PR than it is reform, at least initially. If this money flows to the smaller agricultural banks then that money will have its maximum effect in the shortest amount of time. Vietnam's exports are dominated by coffee, tra fish, rice, rubber and cashews and the high interest rates needed to prick the housing and investment bubble have been devastating to farmers' ability to carry costs through the last two growing cycles.
Up to this point, outside of the strong monetary policy and moves to control the flow of gold (GLD) in country, there has been a lot of discussion but very little action to clean up the large inventory of non-performing loans which are the source of the economic malaise. In the past year, the State Bank of Vietnam has cut interest rates from 13% to 6% in the hopes of engineering a soft landing. Given the number and size of NPLs (officially 4.5% of all loans, unofficially double or triple that number) and bankruptcies (more than 113,000 in two years) that outcome was simply not in the cards.
The latest 100 basis point cut in key rates is likely the last after 7 previous ones. The economy is simply too weak to support lower rates without engendering hyperinflation of the Dong.
The VN index climbed 0.1% on last Friday to close at 500.24, its first weekly close above 500 since April 5th. It has since followed through, threatening the April 10th high at 518.46. It has performed well so far this year and has not repeated last year's Q2 sell off after a strong Q1. The index has returned 21% year-to-date. A weekly close above that April 10th high would be a bullish breakout signal that the latest policy moves have been embraced by investors, primarily foreign institutional ones, who have been actively accumulating all year on the hope that Vietnamese regulators would get serious about cleaning up the debt problems.
The Market Vectors Vietnam Index ETF (VNM) has risen 16.8% this year and like most single country ETFs is heavily weighted towards financial institutions. AUM has risen $103 million, or 29.3%. Clearly there is a lot of speculative bottom-fishing going on in Vietnamese stocks currently. (click to enlarge)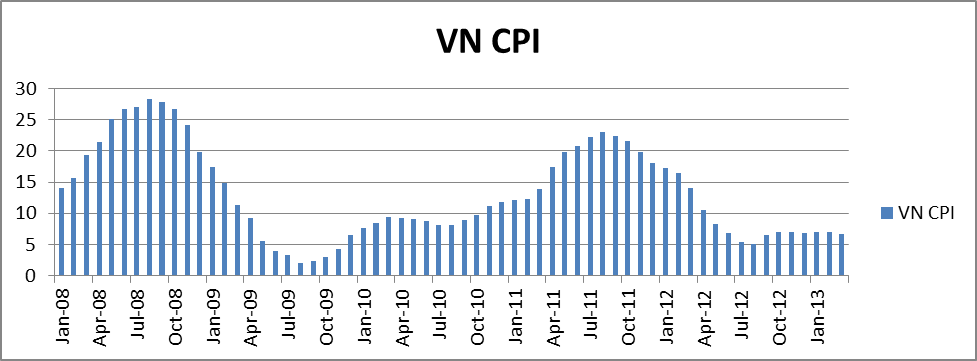
Vietnam's Consumer Price Index came in at 6.36% in May after rising 6.62% in April but even with bringing it down from 20+% at the start of 2012, real interest rates for Dong-denominated deposits are hovering at around positive 1% for 1-month term deposits. Demand deposits are still around -4%.
With all of the turmoil in the Japanese government bond market and yields rising around the world, Vietnam's government bonds have been the latest recipient in the search for yield. 5-year bonds hit their lowest yield since 2007 coming down to 8.11%.
A steeper yield curve has been elusive for Vietnam over the past year. Interbank rates have finally returned to something approaching normal, but as we can see from the data below, the money markets are very volatile in the short term and the SBV is active week to week, keeping the system from locking up.
Vietnam Money Market Rates 5/24/2013 | |||
Days to Term | Rate | Change MTD | Change YTD |
1 | 0.91% | -3.50% | -1.47% |
7 | 1.10% | -3.82% | -1.69% |
14 | 1.47% | -3.68% | -1.88% |
30 | 2.84% | -3.23% | -1.40% |
60 | 4.21% | -2.44% | -0.89% |
90 | 4.60% | -2.88% | -1.09% |
180 | 6.02% | -1.86% | 0.02% |
270 | 7.25 % | -1.45% | -1.25% |
360 | 8.00% | -1.50% | -0.80% |
The decision to create a Vietnam Bad Bank is an excellent move as are the reforms to land use and investment laws currently under review which may be approved this fall and the Party Plenum. If that occurs, it will increase foreign investment returns and opportunities and the VN Index will likely rise.
The IMF lowered its projection for Vietnam's growth to 5.2% this year from 5.8% previously and to 5.2% in 2014 from 6.4%, putting its growth behind its ASEAN peers like Indonesia, Myanmar and Thailand. The Philippines last week received an investment grade rating from Standard & Poor's while Indonesia's economy grew 6.02% in the first quarter - but Indonesia is suffering from a mix of problems that are similar to both India -- high current account deficit from fuel subsidies -- and Vietnam -- extreme credit growth.
However, Vietnam's import demand has been curbed by slower economic growth and the country's balance of trade has improved so far in 2013 --though trade deficits returned in March and April coming in at $1 billion, mostly in the form of gold imports. A stronger trade balance has helped keep the Dong from depreciating further throughout all of the rate cuts and slowing money velocity.
Fitch estimates that the cost of recapitalization of the banks may reach 10% of 2012's GDP with the aim of lowering the NPL ratio to 3% by 2015. But, against this backdrop, the SBV will offer a VND 30 trillion ($1.44 billion) package to provide cheap credit to home buyers and support the real-estate sector which will only work against any of the good done by finally pulling some of the bad debts out of the banking sector.
For now, Vietnam still looks like a country in transition. Its credit bust was one for the ages and it will take a lot more work to sort it all out. Watch the VN Index for directional signs. 520 is an important level to the upside while the recent double bottom at 466 is near-term support in a correction.
In Asia, REITs are gaining popularity because both Singapore and Hong Kong have performed very well in recent years as recipients of real estate investors from markets such as China, the Philippines and Indonesia due in large part of central bank policy which target the U.S. dollar directly in the case of Hong Kong, or U.S. interest rate policy, in the case of Singapore.
REITs continue to attract investors because their dividends are more appealing than other investment opportunities in the current low interest rate environment. The search for yield has created a near mania in equity markets. Many institutional investors switched to the REIT market in recent years away from property developer stocks because of the higher policy risk in their home markets. Singapore has 16 REITs with a market capitalization of $19.3 billion, compared with Hong Kong's 7 REITs presently valued at $8.8 billion. Hong Kong is losing the mainland REIT market to Singapore.
At the moment it s more attractive to be a Singapore REIT than a Hong Kong REIT, said Alastair Gillespie, co-head of Asian real estate research at UBS. Singapore REITs offer the highest yields, both on an absolute basis and in comparison to the country's five-year government bonds -- topping even Australia and Hong Kong. And this, again, is due to the Monetary Authority of Singapore's policy of aping the Fed's interest rate policy. With the Fed holding interest rates down near zero out to 3 years, it is no wonder that S-REITs pack such a favorable spread, even with Singapore's GDP growing very slowly.
The poor showing of REITs in Hong Kong might be that developer sponsors took a short-term view and packaged REITs primarily to divest real estate at the best prices they could get. Singaporean sponsors, on the other hand, have focused on creating acquisitive investment vehicles with defined long-term growth plans. They have also transferred assets into the REITs at more attractive prices, creating value for investors.
Exchange | Company | Yield |
SGX | Sabana REIT | 7.19% |
SGX | Frasers Centrepoint REIT | 4.70% |
SGX | CapitaRetail REIT | 5.30% |
SGX | Cambridge REIT | 5.88% |
SGX | Starhill Global REIT | 5.68% |
HKG | Link REIT | 3.09% |
HKG | Champion REIT | 5.07% |
HKG | Hui Xian REIT | 5.82% |
HKG | Sunlight REIT | 4.86% |
Singapore REITs' income is growing despite Singapore's slowing economic growth partly because many are trading above their net asset values, allowing them to issue equity to finance acquisitions. The FTSE ST REIT index tacked on 5.1% in the first quarter and was up 30.7% for year ending March 31. Meanwhile, leases signed during the global financial crisis are now being renewed at higher rates and many Singapore REITS have begun buying assets outside the land-starved city-state. Singapore has become the second most active purchaser of foreign real estate after Japan in Asia; buying assets in Australia, China, Japan, Malaysia and South Korea, according to CBRE Group Inc.
More flexible regulators and lower interest rates make Singapore the preferred place to list. Singapore has created tax breaks to encourage the listing of REITs, while in Hong Kong, REIT assets are taxed the same way as if they were owned by a company. Singapore REITs' dividends are tax-free provided more than 90% of the firm's income is distributed to investors. No such tax transparency exists for Hong Kong's REITs; they have not gained the same attractions as they have in Singapore. Furthermore, under its Linked Exchange Rate System, Hong Kong's REITs closely track that of the U.S. because of the currency peg. In line with slowly rising U.S. Treasury yields, Singapore's 15-year bond yield has risen to 2.09 % and Hong Kong's to 1.34%. The average yield of 5.13% for Singapore REITs Index is far more attractive than 3.47 % offering in Hong Kong's in a long run. But REIT investors need to watch rising yields on long-term bond yields.
(click to enlarge)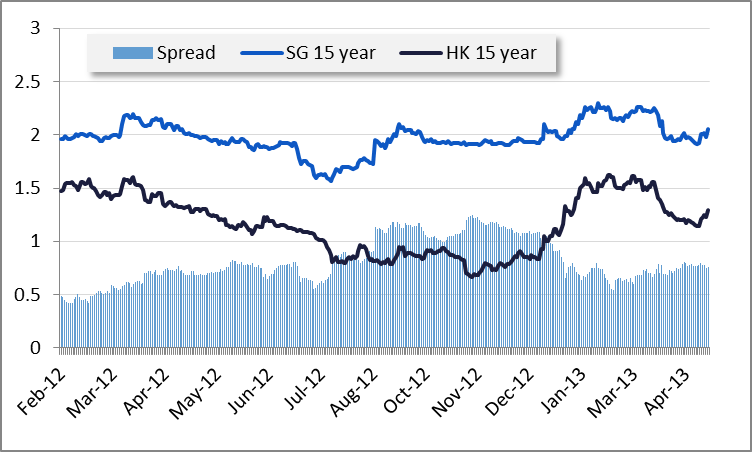
So far, the Fed has been able to engage in QE and have foreign central banks not revolt at the money printing. The latest T.I.C. report shows that both Singapore and Hong Kong have been buyers of U.S. treasury debt since December -- at least through March -- and the start of QEIII/IV. But, in doing this, property valuations around the region are becoming bloated.
As a consequence of running out of real estate, many of these REITs have had to go offshore. The dual primary listing in Singapore and Hong Kong provides a REIT unitholder the flexibility to trade their units on both exchanges, widening the investor base of REIT and providing access to increased liquidity of the units. Fortune REIT, for example, listed in Singapore in 2003 and Hong Kong in 2010 and more REITs are expected to cross-list in these two countries. Moreover, ASEAN Link is creating greater liquidity regionally, allowing Singaporean, Malaysian and Thai stocks to be traded across all three exchanges.
Singapore sets itself apart with its pipeline of strong sponsors and the framework to support REIT listings. Singapore is especially appealing to property owners in countries without proper REIT frameworks such as India, Indonesia, and China where properties may have been trading at below asset value. And we're now seeing both Singapore and Hong Kong REITs branching out into mainland Chinese assets like CapitaLand's (CLLDF.PK) CapitaRetail China Trust. Moreover, Singapore can encourage cross-border REITs with southern Malaysia, one of the fastest growing places in the world because of its proximity to Singapore and special incentives put in place by Malaysia to develop the Iskandar region of Johor State.
Where this may become more interesting is Hong Kong moving to offer the first yuan-denominated REIT outside of China in April. Hui Xian Real Estate Investment Trust, which is aiming to raise up to ¥ 11.2 billion, selling 40% of the company priced between ¥5.24 to ¥5.58 per share. Hong Kong's Securities and Future commission (SFC) has become more accommodating with the last few REITS brought to market. Hong Kong regulations impose restrictions on aggregate borrowings of a REIT, which shall not exceed 45% of the total gross asset value of the REIT while Singapore limits at 35% of the deposited property.
With China making noise about allowing full convertibility of the yuan (CYB) by the end of the year, this is yet another example of the increased presence of the yuan in international finance. With the relentless rise in the yuan this year -- now trading below ¥6.14 up 1.6% year-to-date-this adds currency arbitrage to the valuation equation further eroding the value proposition of Hong Kong Dollar-denominated REITs versus Singapore's as the Singapore Dollar (FXSG) is more closely tied to movements in the yuan than the dollar over the past year. The iShares MSCI Singapore Index ETF (EWS) has far lower exposure to real estate, 15.9% of $ 1.65 billion AUM while real estate accounts for 33.4% of the iShares MCSI Hong Kong Index ETF's (EWH) $ 3.63 billion AUM. EWS's has risen 7% YTD, paying a 3.72 % dividend, while EWH has returned 4% with a 2.42 % yield.
Singapore has more flexibility going forward than Hong Kong as a currency peg is far stricter than the MAS' approach, which makes it much more vulnerable to Federal Reserve policy.