Business dashboards are important tools to measure key performance indicators and data pertaining to an organization or certain procedure. Just as a vehicle dashboard is powerful performance management tool in summarizing a performance of a multitude of processes, a business dashboard summarizes the performance or impact of a host of functions, teams, and activities; and assists in Strategic Planning and decision making.
Business dashboards simplify sharing and analysis of large data, and help users visualize complex performance data in simple yet visually aesthetic manner. Dashboards aid in simplifying complex processes into smaller more manageable information pieces for the organizational leadership to focus on everyday operations. They keep everyone on the same wavelength and prioritize display of facts based on their importance and potential impact. The information on a well-designed dashboard is clear, presentable to enhance meaning, readily accessible, and dynamic. A carefully-planned dashboard allows the leadership to identify and answer business challenges in real-time, develop plan of action based on insights, and inculcate innovation.
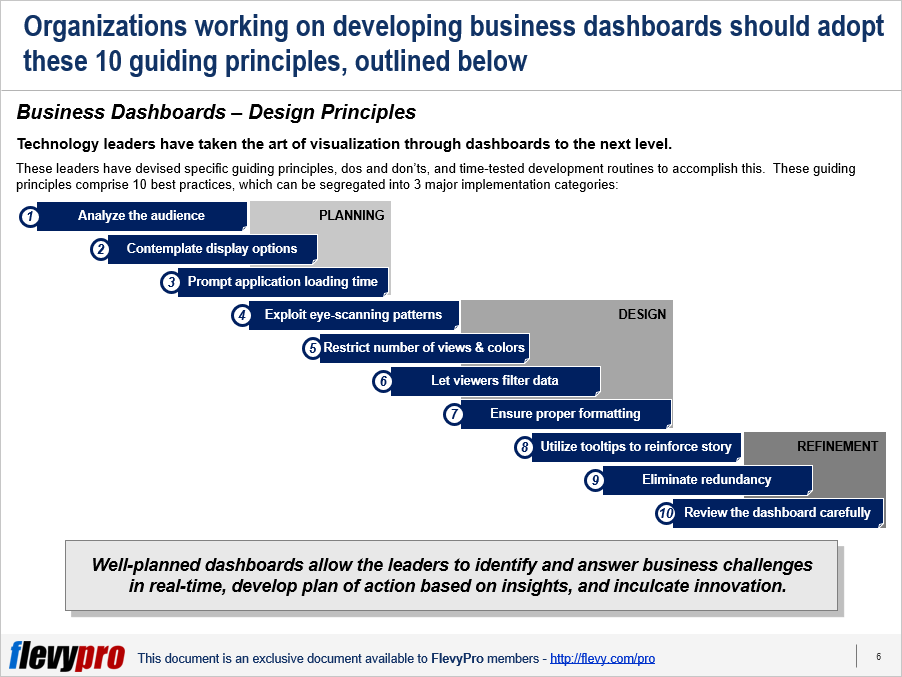
Proficient and capable dashboard designers and firms have taken the art of visualization of valuable indicators and insights through dashboards to the next level. They have devised specific guiding principles, dos and don’ts, and time-tested development routines to accomplish this. These guiding principles comprise 10 best practices, which can be segregated into 3 major implementation categories:
Planning
- Analyze your audience
- Contemplate display options
- Prompt application loading time
Design
- Exploit eye-scanning patterns
- Restrict number of views & colors
- Let viewers filter data
- Ensure proper formatting
Refinement
- Use Tooltips to reinforce story
- Eliminate redundancy
- Review the dashboard carefully
Let's discuss the first 5 best practices for now.
Analyze your audience
A careful analysis and understanding of the business dashboard’s intended audience is the first important principle to consider before commencing the development of such a dashboard. For instance, a busy salesperson in need of quickly going through indicators, whereas senior management needing a deep-down review of quarterly sales results. This gives the developers a thorough idea of what the audience wants from a dashboard, what data they will visualize utilizing this, and let them know the audience’s technical capabilities in terms of data analysis, theme, issue, and business understanding.
Contemplate display options
The second principle to follow in designing a business dashboard is to research your users’ device and display preferences beforehand. Building a dashboard with desktop display options in mind when your audience prefers to use phones to view it could be a disaster. The designers should set the size of the dashboard properly—allowing the users to view it on a range of devices, by building in automatic sizing option for the dashboard to adopt to the dimensions of the browser window.
Prompt application loading time
Your audience and viewers are busy people who hate long waits. Therefore a stunningly designed dashboard would not get the right traction if it takes too much time to load. The dashboard author should facilitate prompt dashboard loading by deciding which filters to add in the dashboard and which ones to exclude. For instance, although filtering is useful in restricting the amount of data analyzed, it effects query performance. Some filters are quite slower than others as they load all of the data for a dimension instead of just what you want to keep. Knowing the Order of Operations is also beneficial in reducing the load times.
Exploit eye-scanning patterns
The dashboard authors should have a deep sense of the main purpose of the dashboard in mind when develop such a tool. They need to be aware of individuals’ eye tracking patterns—typically when most people look at a screen or content, they start scanning the upper left hand corner of the screen first by intuition—and make the best use of the screen space to display the most important content at the right place.
Restrict number of views & colors
The designers often get over enthusiastic during their application designs and try to stuff the dashboard with multiple relevant views. This is detrimental for the bigger picture. They must include not more than 2 to 3 views per dashboard and create more dashboards in case the scope creeps beyond the 2-3 views range. It is also crucial to ensure the content to be clearly visible to the viewer and to use colors correctly to facilitate analysis instead of cramming too many colors in the visuals, which creates a graphical overload for the viewers, slacken analysis (or may even prevent users to analyze data), and even blur the graphics.
Let viewers filter data
Allowing users to filter the data is another best practice to keep in mind while designing business dashboards. This added interactivity encourages data assessment and permits the users to have their most important view act as a filter for the other views in the dashboard. This helps in conducting side-by-side analysis, promotes involvement, and retains users’ interest.
Interested in learning more about the other best practices to aid in designing a robust business dashboard and knowing the most common mistakes to avoid in this process? You can download an editable PowerPoint on Business Dashboard Design here on the Flevy documents marketplace.
Are you a Management Consultant?
You can download this and hundreds of other consulting frameworks and consulting training guides from the FlevyPro library.
Comments