Mark Bridges's Posts (330)

Sort by

8028327897?profile=originalSupply Chain Management is getting more and more complex.  The pressure on the Supply Chain information to be made public is also increasing day by day.  With the popularity and widespread use of social media, it has become more and more difficult for organizations to hide information pertaining to supply chain practices, employees’ treatment, suppliers’ processes, or waste materials generated that could affect the environment.  Social media often publicizes negative reports on companies’ supply chain practices—its best to have a robust information disclosure strategy before anything like that ever happens.

Executives must appreciate these external forces and information transparency demands, and react proactively to build and maintain competitive advantage for their organization.  They need to be able to, first, accurately predict the data requirements of various stakeholders and then unanimously decide on the type and frequency of the information to be shared.  A reactive information disclosure strategy is less time and planning intensive, but it does limit the chances of first-mover advantage over competition.

Supply Chain information can be classified into 4 categories:

  • Critical
  • Strategic
  • Non-critical
  • Optional

Critical Information

Organizations using this information category know that they have certain glitches in their Supply Chains that could potentially be a source of criticism from NGOs and the media and may bear adverse effects on their reputation.  This includes information concerning unhygienic or inferior quality products; unfair supply chain practices; or environmental problems.

Strategic Information

Even though stakeholders do not ask for this information, this information category is considered strategic as disclosing this data can boost brand value and product differentiation.  The strategic information category is high value to the organization but is low on risks for the supply chain.  For example, in the beauty, fashion or food products industry, sharing information about organic ingredients may be instrumental in achieving product differentiation and brand reputation.

Noncritical Information

Disclosure of this information category is typically un-called for and has negligible effects on brand value.  This information category has low value for the company and has low risks for the Supply Chain.  For instance, needlessly sharing child labor data in regions with actively enforced child welfare laws.

Optional Information

This information category is a matter of internal supply chain consideration and has no bearing on the customer.  The optional information category is low value to the organization and is actually highly risky for the Supply Chain.  For instance, potential quality issues and defects in the supply chain that are identified and resolved during quality control, and do not affect the finished product.

There isn’t a one-size-fits-all strategy that organizations can adopt to ensure a viable and high-quality Supply Chain Information Disclosure.  However, the approach needs to be evolving based on individual circumstances.  Senior executives should promptly respond to public inquiries, ensure fair treatment of employees, and guarantee compliance with basic human rights to protect their organizations’ reputation.  Experts suggest the following 8-phase approach to address and improve Supply Chain Information Disclosure.

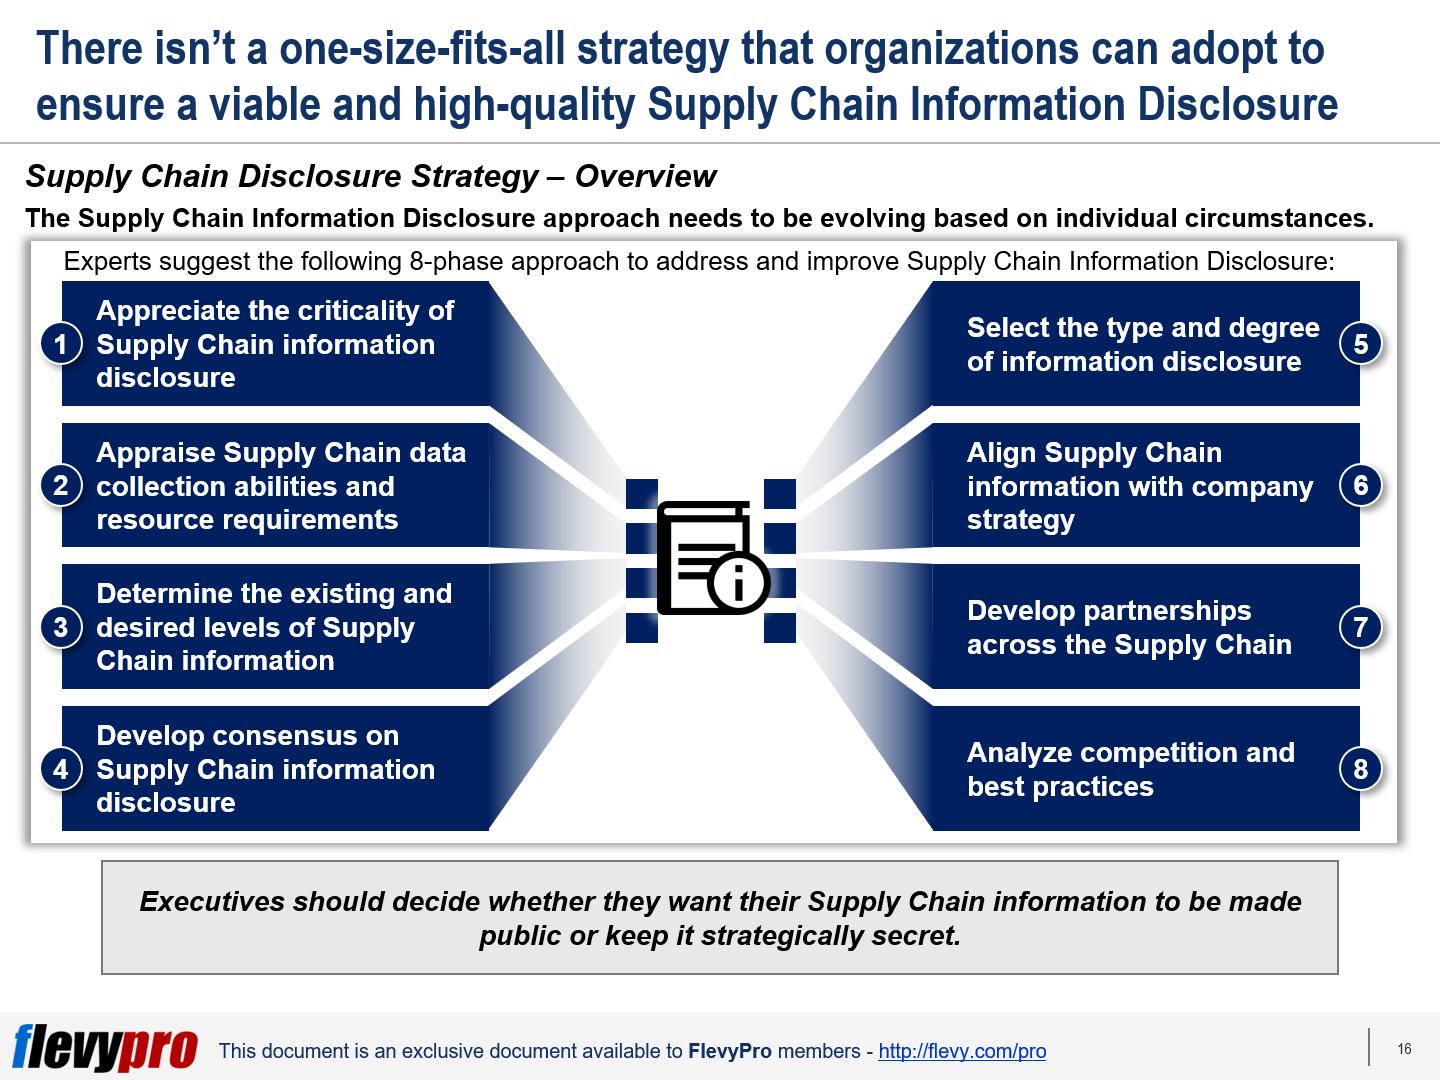
Appreciate the criticality of Supply Chain information disclosure

The first step is to analyze the forces that demand increased supply chain transparency and ascertain the importance and priority of information for the stakeholders.  Once it is established, the leadership must take actions to address the information requirements of key stakeholders.

Appraise Supply Chain data collection abilities and resource requirements

The next step is to assess the competence of the organization—and that of the suppliers—to gather quality supply chain data.  The executives should also evaluate the costs and resource requirements to enable improved information disclosure.

Determine the existing and desired levels of Supply Chain information

The third step is to ascertain the existing knowledge of supply chain information among the executives and suppliers.  The leadership needs to identify the desired levels of supply chain data collection and sharing capabilities, and invest to fill any gaps between the existing and desired supply chain data collection and sharing competencies.

Interested in learning more about the remaining phases of the Supply Chain Information Disclosure Strategy?  You can download an editable PowerPoint on Supply Chain Disclosure Strategy here on the Flevy documents marketplace.

Are you a Management Consultant?

You can download this and hundreds of other consulting frameworks and consulting training guides from the FlevyPro library.

Read more…

8028327853?profile=original

Transformation of an organization into a Next-generation Learning Organization (NLO) is a challenging endeavor.  The main hurdles include convoluted hierarchies, bureaucratic red tape, delayed decision making, and complicated organizational systems and processes.

To develop a learning organization, leadership needs to trim down bureaucracy and complexities.  They should make the best use of technology to gather holistic real-time data, deploy Artificial Intelligence at scale, and develop data-driven decision-making systems.

Five Core Pillars of Learning are essential for the creation of a Next-generation Learning Organization, including:

  1. Digital Transformation
  2. Human Cognition Improvement
  3. Man and Machine Relationship
  4. Expanded Ecosystems
  5. Management Innovation

Let's take a deep dive into the first 3 Core Pillars.

1. Digital Transformation

The first pillar is Digital Transformation.  Next-generation Learning Organizations (NLOs) are characterized by their speed of learning and their adeptness to take action based on new insights.  They use emerging technologies to automate as well as “autonomize” their businesses, without relying too much on human intervention and decision-making.

By autonomizing, the NLOs enable machines to learn, take action, and evolve on their own based on continuous feedback.  They create integrated learning loops where information flows automatically from digital platforms into AI algorithms where it is mined in run-time to gather new insights.  The insights are passed to action systems for necessary action that create more data, which is again mined by AI, and the cycle continues, facilitating learning at fast pace.

2. Human Cognition Improvement

Next-generation Learning Organizations (NLOs) schedule time for their people to have unstructured reflection on their work.  While most organizations fear disruption of human work in future by AI and machines, NLOs assign unique roles to their people based on human cognition strengths—e.g., understanding relationships, drawing causal judgment, counterfactual thinking, and creativity.  These organizations are aware of AI’s advantage—in analyzing correlations in complex data promptly—as well as its shortcomings in terms of reasoning abilities and interpretation of social / economic trends.  NLOs make design the center of their attention and utilize human creativity and imagination to generate new ideas and produce novel products.  They assign roles accordingly, inspire imagination in people by exposing them to unfamiliar information, and inculcate dynamic collaboration.

3. Man and Machine Relationship

NLOs foster innovative ways to promote collaboration between people and machines.  They recognize that this helps them in better utilization of resources, maximize synergies, and learn dynamically.

To create effective collaboration between people and machines, NLOs develop robust human-machine interfaces.  The existing AI systems lack the ability to decipher everything, which is an area where humans excel.  NLOs supplement these shortcomings by setting up human-machine interfaces, where humans assist the AI by corroborating its actions and suggesting sound recommendations.  These learning organizations bifurcate responsibilities based on the risks involved, assign humans and machines appropriately against each job, and select a suitable level of generalization and sophistication between humans and machines.

Interested in learning more about the Core Pillars of Learning?  You can download an editable PowerPoint on Next-generation Learning Organization: Core Pillars here on the Flevy documents marketplace.

Are you a Management Consultant?

You can download this and hundreds of other consulting frameworks and consulting training guides from the FlevyPro library.

Read more…

8028321860?profile=originalPerformance evaluation serves as a health check on operations and individuals’ work.  The organizational maturity notion signifies the progress of an organization in terms of developing its people, processes, technology, and capability by implementing quality practices.  Organizations aiming to achieve the highest maturity levels in performance need to take care of the intricacies involved in deploying a Performance Management system and the relationships it has with the other key organizational activities.

Performance Management processes in organizations can be assessed using maturity levels, by measuring the implementation of Performance Management tools, analyzing the availability of internal Performance Management processes in place, assessing the structures, procedures, and interactions utilized to direct Performance Management systems.

An organization’s performance maturity is assessed on 5 levels of progressive growth.  These 5 stages present a valuable dashboard to gauge the implementation of the corresponding levels of the Performance Management Maturity Model.

  1. Initial 
  2. Emergent
  3. Structured
  4. Integrated
  5. Optimized

To achieve maturity in performance management, organizations need to build capabilities in 5 core elements—referred to as “Operational Levers"—Tools, Processes, Governance, Architecture, and Integration.

Initial Stage

The organizations at the first performance maturity level are not acquainted with—or totally unfamiliar of—the tools necessary to implement the Performance Management system.  The Performance Management processes are typically inconsistent.  Organizations at this maturity level do not practice employee empowerment, development, and innovation.  There is a dearth of appropriate KPI calculation approach and the performance architecture is in its budding stage.  Roles and responsibilities, importance of KPIs, and individual/organizational indicators are unclear to employees.

The level is characterized by casual strategic planning practices—dependent on top management experience—with ill-structured communication mechanisms.  The initiatives lack alignment with organizational goals.  Leadership involvement in mentoring and developing employees is at sub-optimal levels.  Staff motivation and increasing their engagement levels is not given due importance.

Emergent Stage

The organizations at the second level of Performance Maturity have a strong desire to improve performance.  At this stage, organizations begin exploring Performance Management tools, but have uncoordinated and un-standardized internal processes and systems.  Initiatives to integrate performance management procedures are planned with clearly defined objectives and expectations.

However, at this level, strategy does not deliver value and is not more than formal documentation.  Managers are assessed based on performance results, but not the lower hierarchical levels.  There is unclear articulation of company goals, misalignment at various organizational hierarchical levels, and incompetent communication.  A few basic performance measurement methods—e.g., KPI selection and documentation are embraced by the organization.  The KPI selection process, however, lacks appropriate yardsticks, tools, standardized forms/templates, and approaches.  Performance evaluation and reporting processes exist but are deficient in clear communication by the leadership.  Leadership possesses a basic understanding of performance measurement processes.  Measuring performance at the individual level is uncommon at this maturity level.  Performance review meetings are short of delivering the insights required to make critical decisions.

Structured Stage

The “Structured” stage of the Performance Management Maturity Model is characterized by well-coordinated and carefully regulated Performance Management processes.  Organizations at this stage have a defined set of Performance Management tools.  There are standardized Performance Management practices with well-defined and improved process flows.  There is typically an inconsistent approach towards adopting an aligned Performance Management architecture though.

Organizations at this level employ strategy monitoring tools—e.g., scorecards and dashboards—but do not cascade these at the lower ranks and files.  KPIs are selected based on a clear-cut criteria, established tools and methods, and agreement across the board.  Standardized forms are used to document and report KPIs.  The KPI targets are established utilizing data, benchmarking, and comparing market figures.  Organization-wide performance evaluation data is gathered and disseminated at all levels.  People, largely, have a fair understanding of their personal and organizational performance goals.  A well-defined Performance Management system is in place with appropriate templates, procedures, and governance structures ready for each Performance Management cycle.  Incentives and training and development opportunities help improve performance.

Interested in learning more about the other stages of the Performance Management Maturity Model?  You can download an editable PowerPoint on the Performance Management Maturity Model here on the Flevy documents marketplace.

Are you a Management Consultant?

You can download this and hundreds of other consulting frameworks and consulting training guides from the FlevyPro library.

Read more…

8028321065?profile=originalSupply Chain Management across industries has become way too complicated and globalized today.  Since the popularity and use of Social Media has grown, organizations are increasingly getting under pressure to disclose their information publicly.  This pressure on information transparency has reached a level where external stakeholders expect to know the details of an organization’s Supply Chain practices much more than what is typically required to disclose legally.

Executives are finding it hard to deal with this situation.  A majority of them have a limited understanding of the salient features and capabilities of their own Supply Chains, lack the expertise to gather and report Supply Chain data, and fail to develop a Supply Chain Information Disclosure Strategy.

To begin with, they need to first realize the forces that are pushing this trend for information transparency—government regulations, laws, competitors’ best practices, and non-governmental organizations (NGOs).  NGOs often highlight media campaigns to expose poor Supply Chain practices carried out by organizations.  These campaigns may have adverse effects on brand reputation.

Once a fair understanding of these forces has been established, only then executives can develop approaches to deal with these information transparency trends effectively.

Supply Chain Information Categories

The growing demand and understanding of organizations to make Supply Chain information transparent warrants them to have an in-depth know how of what is required to accomplish this and the constraints therein—e.g., their data collection capabilities, the resources required to establish reporting systems, the technology requisites, and clearly defined standards for reporting systems.

Supply Chain Management experts identify 4 categories of Supply Chain information that organizations can publicly disclose:

  1. Supply Chain Membership
  2. Provenance
  3. Environmental Information
  4. Social Information

1. Supply Chain Membership

This category pertains to information related to the suppliers.  It includes basic supplier information, e.g., the names of first-tier direct suppliers and supplier locations.  For instance, Nike shares a list of its global suppliers for the entire product range with names, locations, workforce composition, and subcontracting status of every supplier.

2. Provenance

This category entails information related to ensuring compliance of materials used to produce products with regulatory standards.  Specifically, this includes source (material) locations, material extraction practices, and compliance with safety and quality standards.

3. Environmental Information

This category pertains to reports on environmental measures, including carbon and energy usage levels, water use, air pollution, and levels of waste in the Supply Chain.

4. Social Information

This category entails reports on labor policies (health & safety conditions, work hours), human rights data, and social impacts of the Supply Chain (community involvement and development work).

Supply Chain Information Transparency Strategies

There is no one-size-fits-all approach to information disclosure that suits every firm­.  Once senior management has evaluated the leading best practices on types of Supply Chain information that can be shared publicly, their emphasis should be on determining and agreeing on the level of Supply Chain information disclosure that is ideal for their organization.  Senior executives can select a viable strategy from the following 4 typical Supply Chain Information Disclosure Strategies:

  1. Transparent
  2. Secret
  3. Distracting
  4. Withheld

Transparent

This strategy involves maximum public availability of all Supply Chain information. Companies following the “Transparent” strategy regard information disclosure as a core competence.  They take full disclosure of their Supply Chain information as a commitment to satisfy external stakeholders.

For instance, Nike was criticized throughout the 1990s for poor working conditions in its Supply Chain, but now it is recognized as a leader for its responsible supply chain membership, provenance, environmental, and social sustainability information disclosure.

Interested in learning more about the remaining Supply Chain Information Transparency Strategies?  You can download an editable PowerPoint on Supply Chain Information Transparency Strategies here on the Flevy documents marketplace.

Are you a Management Consultant?

You can download this and hundreds of other consulting frameworks and consulting training guides from the FlevyPro library.

Read more…

8028317477?profile=originalReducing the fragility of global Supply Chains in the event of disruption through natural or other disasters is a major concern for most senior executives.  This rings true more so now than ever, as the world grapples with COVID-19, the worst human health crisis in 100 years.

The strategies to enhance the effectiveness and readiness level of Supply Chains and to reduce risks associated with disruption come with a price.  These costs are critical to build Supply Chain Resilience across all industries.

However, these expenses are, generally, considered a hindrance in the implementation of risk reduction strategies by many leaders.  This is one of the major factor that precludes them from anticipating and managing Supply Chain Risks.

Able leaders anticipate these risks and invest in building organizational resilience.  They leverage a couple of potent Supply Chain Risk Reduction Strategies that have nominal impact on cost efficiency but offer substantial reduction of disruption risks:

  1. Diversify supply base
  2. Overestimate likelihood of disruptions

Diversify Supply Base

It is vital for organizations to diversify their supplier base to avoid disruption of their Supply Chains in the event of a natural disaster.  Manufacturers have been found to have been using pooling—combining resources, inventory and capacity by maintaining fewer distribution centers—and producing common parts to help reduce costs.  However, too much pooling and commonality can make the Supply Chain vulnerable to disruption.

For instance, relying too much on a single supplier and common parts—in an effort to be as lean and efficient as possible—became a Supply Chain Analysis nightmare and cost Toyota billions of dollars in terms of lost sales and product recalls in 2010.  Back then, the auto manufacturer was counting on a single supplier for a common part for many of its car models, which was effective in curtailing costs, but turned out to be a disaster.

Organizational leadership should evaluate the trade-offs between having a leaner and efficient Supply Chain—with common parts and single suppliers—and preparing for and reducing the risks of disruptions.  Minimizing the number of distribution centers offers diminishing marginal returns for Supply Chain Performance and increases the Supply Chain Fragility.  Creating little bit of commonality presents significant advantages, but when more parts are made common the benefits shrink and it rather becomes detrimental.

The key for senior leaders is to find an optimal balance between resource pooling, creating common parts, and deciding on whether to decentralize or centralize their Supply Chains.  Decentralization (e.g., by having multiple warehouses or plants) increases costs as it requires more inventory, but it does curtail the effect of disruption significantly.  Centralization or pooling of resources, on the other hand, reduces total costs, but the cost again goes up by centralizing beyond a reasonable degree.  Recurrent Supply Chain Risks necessitate focusing more on centralization and pooling of resources and commonality of parts, while rare disruptive risks necessitate decentralization.  Achieving a state of equilibrium between pooling of resources, parts commonality or fewer plants helps keep Supply Chain Risks low.  Ignoring the possibility of disruption can be very expensive in the long term.  Samsung Electronics Co. Ltd. always maintain at least two suppliers, no matter if the second supplier supplies only a fraction of the volume.

Overestimate Likelihood of Disruptions

The risk of disruption of supply chains due to any unforeseen event is typically considered a rare possibility and goes unaccounted for during planning by most executives.  A fire break out at a distribution center, defective auto part, or a supplier’s facility closure for a prolonged period of time can happen anywhere, but we tend to underestimate the likelihood of such events.  The reason for this is attributed to the requirement of assigning a significant chunk of investments upfront from the already limited resources and budgets, to prepare for and mitigate likely disruptive risks.

Most of our typical risk assessment measures involve approximating the probability and the likely damage caused by an event.  Estimating the likelihood of disruptive risk to a reliable degree isn’t easy even for large multinationals—even an auto manufacturer like Toyota could not anticipate the occurrence of the part failure issue until the damage had been done.  These risk estimations do not have to be strictly precise.  Rough estimates of disruption risk are fine—any small mis-estimates that occur have negligible consequences.

Senior leadership needs to cautiously contemplate the areas that are likely to get affected the most due to potential disruption.  Building resilience does not cost much for large organizations.  In the long term, doing nothing costs much more than investing in preparing for a probable disruption.  When disruption occurs, the loss incurred greatly exceeds the amount of saving executives save by not investing in risk mitigation strategies.

Interested in learning more about the subject in detail?  You can download an editable PowerPoint on Supply Risk Reduction Strategies here on the Flevy documents marketplace.

Are you a Management Consultant?

You can download this and hundreds of other consulting frameworks and consulting training guides from the FlevyPro library.


Read more…

8028322459?profile=original

Supply Chains often get disrupted by calamities that are beyond human control.  Natural disasters, such as tsunamis and floods, in the last decade have drastically affected major businesses—from automobiles to technology, to travel, to shipments—and exposed critical weaknesses in Supply Chain mechanisms around the globe.  And, now, we are living through a global disruption of an unparalleled nature, COVID-19.

Organizations that rely on single-source suppliers, common parts, and centralized inventories are more susceptible to the risk of disruption.  Management in most cases is aware of its responsibility to prevent their Supply Chains from getting disrupted by ensuring measures such as keeping enhanced stocks, improving capacity at discrete facilities, and choosing multiple sources.  But these measures have a negative effect on Supply Chain cost efficiencies.

However, discerning the effects of costly Supply Chain disruptions is one thing and taking actions to avoid such situations or mitigating their undesirable effects is another.  Managing Supply Chain risks necessitates careful evaluation of the impact that these measures have on Supply Chain cost efficiencies and bottom line.  During the COVID-19 pandemic, it has become clearer than ever that Supply Chain Management must also involve this form of Risk Management.

Supply Chain Efficiency entails improving the financial performance of an organization and focusing on improving the way we manage supply and demand.  Demand fluctuations or supply delays are independent and can be typically tackled by having appropriate inventory levels in the right place, better planning and implementation, and improving Supply Chain Cost Efficiency.

Supply Chain Containment

Supply Chains are complex operations encompassing many products or commodities that are sourced, manufactured or stored in multiple locations.  These complexities can slash efficiency, cause delays, suspension of operations, and increased risk of disruption.  Containing complexities brings higher cost efficiencies and reduced risks.

Supply Chain Containment ensures that Supply Chain disruptions caused by internal factors or through natural hazards are contained within a portion of the Supply Chain.  A single Supply Chain for the entire organization seems cost effective in the short term, but even a small issue can trigger a disaster.

Supply Chain Containment Strategies

Supply Chain Containment Strategies are useful for the organizations to design and deploy solutions fairly quickly in the event of disruption through natural disasters.  The objective is to limit the impact of disruption through disasters to a minimum—to just a portion and not the entire Supply Chain.

For instance, in order to reduce the impact of parts shortage, a mechanical parts manufacturer should arrange multiple supply sources for common items or limit the number of common items across different models.  To reduce Supply Chain instability and to improve financial performance, organizations can use the following containment strategies:

  1. Supply Chain Segmentation
  2. Supply Chain Regionalization

Supply Chain Segmentation

The basis for Supply Chain segmentation are volume, product diversity and demand uncertainty.  High margin but low-volume products with high-demand uncertainty warrant keeping Supply Chains flexible, with capacity that is centralized to aggregate demand.  Manufacturing everything in high-cost locations is detrimental to profit margins.  Sourcing responsive suppliers from Europe is a model feasible for trendy high-end items only.  For fast-moving, low margin, basic products it is sensible to source from multiple low-cost suppliers.  Centralization is favorable in case of fewer segments, significant product variety, low sales volumes of individual products, and high demand uncertainty to achieve reasonable levels of performance.  Decentralization is suitable in case of higher sales volumes, less demand uncertainty, and more segments, to help become more responsive to local markets and reduce the risk of disruption.  For instance, utility companies utilize low-cost coal-fired power plants to handle predictable demand, whereas employ higher-cost gas- and oil-fired power plants to handle uncertain peak demand.

Supply Chain Regionalization

Supply Chain Regionalization helps curtail the impact of losing supply from a plant within the region.  For instance, Japanese automakers were badly hit by shortage of parts globally in the event of 2011 tsunami, since most of these parts could be sourced only from storage and distribution facilities in the tsunami-affected regions.  Had they operated with decentralized regional Supply Chains with logistics centers dispersed in various locations they would have significantly contained the impact of disruption.

Supply Chain Regionalization lowers distribution costs while also reducing risks in global Supply Chains.  During periods of low fuel and transportation costs, global Supply Chains minimize costs by locating production where the costs are the lowest.  As transportation costs rise, global Supply Chains may be replaced by regional Supply Chains.  Regionalized Supply Chains with same inventory stored in multiple locations appear wasteful, but are more robust in case one of the logistics centers suffers from a disaster.

Interested in learning more about the Supply Chain Segmentation and Regionalization?  You can download an editable PowerPoint on Supply Chain Containment Strategies here on the Flevy documents marketplace.

Are you a Management Consultant?

You can download this and hundreds of other consulting frameworks and consulting training guides from the FlevyPro library.

Read more…

8028315686?profile=originalUnsuccessful software applications cost organizations significant efforts and resources.  The reasons for these failed ventures are often attributed to technology issues.  However, the real issue is flaws in business processes—the enterprise application deployment environment and the ecosystem which the application targets.

This calls for ensuring the organizational readiness before initiating technology deployment.  It is for this reason the Business Process Maturity Model (BPMM) originated.  BPMM helps achieve uniform standards, identify weaknesses in workflows, and create standardized tailored processes that simplify the requirements for enterprise applications.

BPMM’s roots can be traced back to the Process Maturity Framework (PMF) created by Watts Humphrey and his colleagues at IBM in the late 1980s.  Process Maturity Framework explores the ways to introduce quality practices in software development.  Humphrey and his colleagues introduced incremental stages to adopting best practices in software organization.  The PMF served as the groundwork for the development of the Capability Maturity Model (CMM) for software in 1991.  CMM then became the foremost standard for appraising the capability of software development organizations.

BPMM ensures the success of enterprise systems by providing proven methods for system requirements validity; accuracy of use cases, and effectiveness of applications; simplification of requirements for enterprise applications; and providing a reliable standard for appraising the maturity of business process workflows.

The Guiding Principles for BPMM

BPMM considers processes as workflows across organizational boundaries.  The key guiding principles governing BPMM are:

  • A process should be analyzed in terms of its contribution to organizational objectives.
  • It depends on the organizational ability to sustain efficient processes.
  • Process Improvement should be ideally executed as a phased Transformation endeavor that aims to achieve successively more predictable states of organizational capability.
  • Each stage or maturity level works as a groundwork to build future improvements.

BPMM Utility

BPMM has the following 4 primary utilities.

  • To drive business process improvement initiatives
  • To gauge enterprise application deployment risks
  • To ensure selection of capable suppliers
  • To Benchmark

BPMM – Conformance

Evaluating the BPMM conformance is about ensuring that the implemented system meets the needs of the client.  Verification of conformance necessitates an effective appraisal technique to gather multiple forms of evidence to evaluate the performance of the practices contained in the BPMM.

The BPMM conformance appraisal should be headed by an authorized Lead Appraiser—external to the organization, trained in BPMM as well as appraisal methods.  The team under the lead appraiser should include some members internally from the organization.  The BPMM conformance appraisal team gathers and analyzes evidence regarding the implementation of BPMM practices, judges their strengths and weaknesses, and gauges their effectiveness in meeting the goals of the process areas at respective maturity levels.

The following evidence is utilized during BPMM conformance appraisals:

  • Review of outputs produced as a result of a process.
  • Review of objects, documents, products supporting the execution of a process.
  • Interviews with individuals that perform a process and those who support and manage it.
  • Quantitative data that depicts the organizational state, employee behaviors, performance, and results of a process.

BPMM Conformance Appraisals

BPMM Conformance Appraisals help assure the implementation of practices at a level that achieve the intent and goals of the practices and their process areas.  BPMM conformance appraisals are of 4 distinct types:

  • Starter Appraisal:  An inexpensive BPMM conformance appraisal—which takes only a few days—that entails gathering quantitative data by conducting few interviews.
  • Progress Appraisal:  An extensive appraisal that entails quantitative data collection, investigation of all process areas and practices, review of artifacts, and analysis of interviews.
  • Supplier Appraisal:  An appraisal method to select sources and to make informed decisions during procurement contracts.
  • Confirmatory Appraisal:  A rigorous investigation of all process areas / practices where all evidence is accounted for.

BPMM – Maturity Levels

BPMM encompasses 5 maturity levels that signify the Transformation of an organization on the basis of improvements in its processes and capabilities.  BPMM Maturity levels 2, 3, 4, and 5 each contain 2 or more process areas, whereas the Maturity level 1 does not contain any process areas.  The 5 successive levels of BPMM are:

  1. Initial

The focus of the BPMM level 1 is on achieving economy of scale, automation, and productivity growth by encouraging people to overcome challenges and complete their tasks.

  1. Managed

The 2nd maturity level aims at developing repeatable practices, minimizing rework, and satisfying commitments — by managing work units and controlling workforce commitments.

  1. Standardized

The focus of the 3rd maturity level of BPMM is to accomplish standardization in terms of business processes, measures, and training for product and service offerings.

  1. Predictable

The 4th maturity level aims at achieving stable processes, knowledge management, reusable practices, and predictable results.  Organizations accomplish these results through standardization and managing processes and results quantitatively.

  1. Innovating

The focus of the organizations operating at the highest maturity level of BPMM is on implementing continuous improvements, developing efficient processes, and inculcating innovation.


Interested in learning more about the process areas and practices at various maturity levels of the Business Process Maturity Model?  You can download an editable PowerPoint on Business Process Maturity Model here on the Flevy documents marketplace.

Are you a Management Consultant?

You can download this and hundreds of other consulting frameworks and consulting training guides from the FlevyPro library.

Read more…

8028318865?profile=original

Business environment has transformed drastically from what it was a century ago.  It has become immensely challenging due to competition, disruptive technologies, laws, and globalization.  These challenges warrant better performance to address customer needs and to survive—and outpace—intense competition.  Consequently, organizations have become complex.

The work that individuals perform in an organization has also shifted from manual labor and clerical jobs to knowledge-based experiential tasks.  Traditional workforce was required to adhere to commands and stick to routines, whereas today’s workforce needs to be more empowered, innovative, able to adapt to varying circumstances, and render sound judgment.

Adapting with the constantly changing business environment is essential for organizations aspiring to succeed in today’s competitive markets.  In order to stay competitive, more and more organizations across the globe are undertaking Business Transformation programs to reorganize their businesses.  However, a large percentage of such programs fail to achieve the desired outcomes.

For the Organizational Design to be successful, leaders need to be mindful of the revolutionized work settings and business environment of this age.  One of the major factors attributed to these failure rates is utilizing traditional approaches to reorganization, which are proving ineffective in this digital age.  These traditional approaches appreciate “level of control” and power, and underestimate the significance of employee autonomy and innovation. 

The Smart Design Approach to Organization Design

Today’s Knowledge Economy necessitates the employees to be more empowered to decide on their own than merely following commands.  People act in ways that are best for their own interests.  The new approach to reorganization—termed Smart Organizational Design—aligns the workforce’s best interests with the organizational mission rather than seeking control over the employees.  The focus is on changing the environment (context) and mindsets of employees willingly and instilling team work and cooperation, thereby enhancing organizational performance considerably.

The Smart Organizational Design approach entails classifying the existing workforce behaviors, ascertaining the desired behaviors critical to improve performance, and providing environment (context) favorable to develop new behaviors.  The approach encompasses 3 main steps:

  1. Define why reorganization is necessary (objective)
  2. Determine the behaviors critical to support reorganization
  3. How to execute the Smart Organizational Design

Let’s dig deeper into the second step.

Determine the behaviors critical to support reorganization

The next step involves the leadership to determine the “what” element of the Smart Organizational Design approach—i.e., definition of certain behaviors critical to achieve the transformation purpose.  Determining the desired behaviors necessitates thinking through the following 4 critical Smart Organizational Design aspects.  These 4 design aspects work in tandem to shift the environment (context) for the workforce and motivate them to embrace the new behaviors crucial for improved performance:

  • The Organizational Structure aspect—pertains to management reporting lines, spans of control, and layers of hierarchy.
  • The Roles and Responsibilities aspect interprets individual and shared accountabilities to cultivate teamwork and cooperation.
  • The Individual Talent aspect specifies the right skill set and motivation to perform responsibilities of each role effectively.
  • The Organizational Enablers aspect outlines the elements necessary for creating the right context (environment) for embracing the desired behaviors, i.e., decision processes, performance management, and talent management.

Interested in learning more about the other step of the Smart Organizational Design approach and the factors critical for its success?  You can download an editable PowerPoint on Smart Organizational Design here on the Flevy documents marketplace.

Are you a Management Consultant?

You can download this and hundreds of other consulting frameworks and consulting training guides from the FlevyPro library.

Read more…

8028316076?profile=original

Inculcating productive workforce behaviors is of utmost significance in Business Transformation, successful Strategy Execution, and Performance Improvement.  However, making people embrace productive behaviors involves a concerted effort across the organization.

The realization of Transformation, Strategy, and Performance improvement goals can become a reality by developing a thorough understanding of the 4 components of Organizational Behavior.  These components act as powerful levers in shaping the desired behaviors in the workforce:

  1. Organizational Structure
  2. Roles and Responsibilities
  3. Individual Talent
  4. Organizational Enablers

These Organizational Design levers work effectively when combined and aligned.  Let’s discuss the first 2 levers in detail now.

Organizational Structure

Organizational Structure represents the management reporting lines that create the organization’s spans of control, layers, and number of resources.  Organizational Structure is a foundational driver to Organizational Design, which also has a strong positive bearing on promoting the behaviors critical to improve the overall performance of the enterprise.  This is owing to the power that a position exerts on the subordinates based on factors that are important for individuals—e.g., work, compensation, and career ladder.

The Organizational Structure indicates an enterprise’s priorities.  An organization is typically structured in accordance with its top most priority.  For instance, functional organizational structure is adopted by enterprises having functional excellence as a priority.  In present-day’s competitive markets, most organizations have to deal with several priorities at a given time, which could be conflicting.  However, this does not mean adding new structures on top of existing ones, thereby increasing unnecessary complexity.  Creating overly complex structures to manage multiple priorities results in red tape and delayed decisions.  All roles are interdependent, necessitating cooperation.  This means taking care of the needs of others—instead of just watching over personal priorities—and encouraging individual behaviors that boost the efficiency of groups to achieve collective objectives.

Roles & Responsibilities

Roles and responsibilities deal with tasks allocated to each position and individual.  Organizational Design depends heavily on redefining clearer and compelling roles and responsibilities—to avoid any duplication of efforts or creating adversaries among team members.  In a collaborative culture where cooperation is the mainstay of an organization, individuals should not only be aware of what is required of them, but also appreciate the responsibilities of their team members, the authorities their roles exercise, the skills required, and the metrics to measure success.

A methodical way to outline roles and responsibilities effectively—while minimizing complexity—that encourages cooperation and empowerment is through the “Role Chartering” technique.  The technique requires distinctly identifying all roles on the basis of 6 key factors:

  • Describing shared and individual accountabilities
  • Outlining indicators to track success
  • Specifying who has the right to decide what
  • Indicating the capabilities critical for roles
  • Assigning the leadership traits valuable for the roles
  • Charting the abilities required for accomplishing personal and team goals.

Interested in learning more about these components to Organizational Behavior?  You can download an editable PowerPoint on Organizational Behaviors here on the Flevy documents marketplace.

Are you a Management Consultant?

You can download this and hundreds of other consulting frameworks and consulting training guides from the FlevyPro library.

Read more…


Business dashboards are important tools to measure key performance indicators and data pertaining to an organization or certain procedure.  Just as a vehicle dashboard is powerful performance management tool in summarizing a performance of a multitude of processes, a business dashboard summarizes the performance or impact of a host of functions, teams, and activities; and assists in Strategic Planning and decision making.

Business dashboards simplify sharing and analysis of large data, and help users visualize complex performance data in simple yet visually aesthetic manner.  Dashboards aid in simplifying complex processes into smaller more manageable information pieces for the organizational leadership to focus on everyday operations.  They keep everyone on the same wavelength and prioritize display of facts based on their importance and potential impact.  The information on a well-designed dashboard is clear, presentable to enhance meaning, readily accessible, and dynamic.  A carefully-planned dashboard allows the leadership to identify and answer business challenges in real-time, develop plan of action based on insights, and inculcate innovation.

Proficient and capable dashboard designers and firms have taken the art of visualization of valuable indicators and insights through dashboards to the next level.  They have devised specific guiding principles, dos and don’ts, and time-tested development routines to accomplish this.  These guiding principles comprise 10 best practices, which can be segregated into 3 major implementation categories:

  1. Planning

  • Analyze your audience
  • Contemplate display options
  • Prompt application loading time
  1. Design

  • Exploit eye-scanning patterns
  • Restrict number of views & colors
  • Let viewers filter data
  • Ensure proper formatting 
  1. Refinement

  • Use Tooltips to reinforce story
  • Eliminate redundancy  
  • Review the dashboard carefully

Let's discuss the first 5 best practices for now.

Analyze your audience

A careful analysis and understanding of the business dashboard’s intended audience is the first important principle to consider before commencing the development of such a dashboard.  For instance, a busy salesperson in need of quickly going through indicators, whereas senior management needing a deep-down review of quarterly sales results.  This gives the developers a thorough idea of what the audience wants from a dashboard, what data they will visualize utilizing this, and let them know the audience’s technical capabilities in terms of data analysis, theme, issue, and business understanding.

Contemplate display options

The second principle to follow in designing a business dashboard is to research your users’ device and display preferences beforehand.  Building a dashboard with desktop display options in mind when your audience prefers to use phones to view it could be a disaster.  The designers should set the size of the dashboard properly—allowing the users to view it on a range of devices, by building in automatic sizing option for the dashboard to adopt to the dimensions of the browser window.

Prompt application loading time

Your audience and viewers are busy people who hate long waits.  Therefore a stunningly designed dashboard would not get the right traction if it takes too much time to load.  The dashboard author should facilitate prompt dashboard loading by deciding which filters to add in the dashboard and which ones to exclude.  For instance, although filtering is useful in restricting the amount of data analyzed, it effects query performance.  Some filters are quite slower than others as they load all of the data for a dimension instead of just what you want to keep.  Knowing the Order of Operations is also beneficial in reducing the load times.

Exploit eye-scanning patterns

The dashboard authors should have a deep sense of the main purpose of the dashboard in mind when develop such a tool.  They need to be aware of individuals’ eye tracking patterns—typically when most people look at a screen or content, they start scanning the upper left hand corner of the screen first by intuition—and make the best use of the screen space to display the most important content at the right place.

Restrict number of views & colors

The designers often get over enthusiastic during their application designs and try to stuff the dashboard with multiple relevant views.  This is detrimental for the bigger picture.  They must include not more than 2 to 3 views per dashboard and create more dashboards in case the scope creeps beyond the 2-3 views range.  It is also crucial to ensure the content to be clearly visible to the viewer and to use colors correctly to facilitate analysis instead of cramming too many colors in the visuals, which creates a graphical overload for the viewers, slacken analysis (or may even prevent users to analyze data), and even blur the graphics.

Let viewers filter data

Allowing users to filter the data is another best practice to keep in mind while designing business dashboards.  This added interactivity encourages data assessment and permits the users to have their most important view act as a filter for the other views in the dashboard.  This helps in conducting side-by-side analysis, promotes involvement, and retains users’ interest.

Interested in learning more about the other best practices to aid in designing a robust business dashboard and knowing the most common mistakes to avoid in this process?  You can download an editable PowerPoint on Business Dashboard Design here on the Flevy documents marketplace.

Are you a Management Consultant?

You can download this and hundreds of other consulting frameworks and consulting training guides from the FlevyPro library.


Read more…

8028311877?profile=originalThe Value Chain concept, first described by Dr. Michael Porter in 1985, is a series of actions that a firm—in a specific industry—accomplishes to produce a valuable product or service for the market.  The value chain notion visualizes the process view of an organization, perceiving a manufacturing or service organization as a system comprised of subsystems of inputs, transformation processes, and outputs.

Another way to define the Value Chain principle is, “transforming business inputs into outputs, thereby creating a value much better than the original cost of producing those outputs.”  These inputs, processes, and outputs entail acquiring and utilizing resources—finances, workforce, materials, equipment, buildings, and land.

An industry Value Chain includes the suppliers that provide the inputs, creation of products by a firm, distribution value chains, till the products reach the customers.  The way Value Chain activities are planned and executed determines the costs and profits.

Value chains consist of set of activities that products must undergo to add value to them.  These activities can be classified into 2 groups:

  • Primary Activities
  • Secondary Activities

Primary activities in Porter's Value Chain are associated with the production, sale, upkeep, and support of a product or service offering, including:

  • Inbound Logistics
  • Operations
  • Outbound Logistics
  • Marketing and Sales
  • Service

 The secondary activities and processes in Porter’s Value Chain support the primary activities.  For instance:

  • Procurement
  • Human resource management
  • Technological development
  • Infrastructure

Value Chain Analysis Benefits

The analysis of a Value Chain offers a number of benefits, including:

  • Identification of bottlenecks and making rapid improvements
  • Opportunities to fine-tune based on transforming marketplace and competition
  • Bringing out the real needs of an organization
  • Cost reduction
  • Competitive differentiation
  • Increased profitability and business success
  • Increased efficiency
  • Decreased waste
  • Delivery of high-quality products at lower costs
  • Retailers can monitor each action throughout the entire process from product creation to storage and distribution to customers.

Value Chain Analysis (VCA) Approach

Businesses seeking competitive advantage often turn to Value Chain models to identify opportunities for cost savings and differentiation in the production cycle.  The Value Chain Analysis (VCA) process encompasses the following 3 steps:

  • Activity Analysis
  • Value Analysis
  • Evaluation and Planning

Activity Analysis

The first step in Value Chain Analysis necessitates identification of activities that are essential to undertake in order to deliver product or service offerings.  Key activities in this stage include:

  • Listing the critical processes necessary to serve the customers—e.g., marketing, sales, order taking, distribution, and support—visually on a flowchart for better understanding.
    • This should be done by involving the entire team to gather a rich response and to have their support on the decisions made afterwards.
  • Listing the other important non-client facing processes—e.g., hiring individuals with skills critical for the organization, motivating and developing them, or choosing and utilizing technology to gain competitive advantage.
  • This stage also entails gathering customers’ input on the organization’s product or service offerings and ways to continuously improve.

Value Analysis

The second phase of the Value Chain Analysis necessitates identifying tasks required under each primary activity that create maximum value.  This phase is characterized by:

  • Ascertaining the key actions for each specific activity identified during the first phase.
  • Thinking through the "value factors"— elements admired by the customers about the way each activity is executed.
    • For example, for the order taking process, customers value quick response to their call, courteous behavior, correct order entry, prompt response to queries, and quick resolution of their issues.
  • Citing the value factors next to each activity on the flowchart.
  • Jotting down the key actions to be done or changes to be made to under each Value Factor.

Interested in learning more about the other phases of the Value Chain Analysis Approach?  You can download an editable PowerPoint on Strategy Classics: Porter’s Value Chain here on the Flevy documents marketplace.

Are you a Management Consultant?

You can download this and hundreds of other consulting frameworks and consulting training guides from the FlevyPro library.

Read more…

8028307876?profile=original

As the last decisive step in customer service, a warehouse ensures cost effective distribution.  Latest technological innovation has turned warehousing into a competitive advantage.  It offers untapped potential for improvement. However, warehousing is a hugely neglected part of global supply chains.  There is inconsistency in picking, packing and shipping orders, storing receipts, and managing inventory and logistics operations.

These and the following roadblocks in the way of smooth warehousing operations and Lean Management exist in every traditional warehouse:

  • Lack of focus on acquiring technology to facilitate in improving efficiency and quality.
  • Inability to utilize a structured approach to ascertain the reasons for poor performance.
  • Lack of a big picture viewpoint pertaining to processes, costs, or external supply chain partnerships.
  • Absence of a continuous improvement culture to achieve warehouse operations excellence.
  • Lack of communication, organization, and proper training of resources.

These shortcomings call for implementing Lean Warehousing methodology to unlock improvement opportunities and savings in operational, efficiency, and maintenance related costs.  First initiated by Toyota, the Lean Warehousing approach has a deep emphasis on eliminating 3 basic limitations: waste, variability, and inflexibility. The Lean Warehousing methodology focuses on the following 3 improvement areas:

  1. Cost Reduction
  2. Customer Quality
  3. Service Levels

Cost Reduction

The Lean Warehousing methodology concentrates on increasing productivity and reducing operating costs.  This is achieved by:

  • Cutting undue walking and searching
  • Preventing needless replenishment, reworks, waiting times, and double handling
  • Upgrading demand and capacity planning and manpower allocation

Customer Quality

A Lean Warehouse seeks to take the customer quality to the next level by avoiding:

  • Order deviations
  • Picking errors
  • Damaged goods

Service Levels

Improving service levels is at the center of a Lean Warehousing methodology, which involves:

  • Reducing lead times
  • Enhancing on-shelf availability

Lean Warehousing Transformation

Lean Warehousing Transformation entails streamlining operations to identify waste, know how to increase service levels, implement standardization and innovative ideas, and learn to evaluate and manage performance.  Such transformation becomes a reality in an experiential learning environment and by developing organizational capabilities in 3 critical areas:

  1. Operating System
  2. Management Infrastructure
  3. Mindset and Behaviors

Operating System

The organizational capability to configure and optimize all company physical assets and resources to create value and minimize losses.  The focus areas under operating systems include eradicating variability, encouraging flexibility, and promoting end-to-end design.

Management Infrastructure                                                                   

The organizational capability to strengthen formal structures, processes, and systems necessary to manage the operating system to achieve business goals.  The focus areas under Management Infrastructure are performance management, organizational design, capability building, and functional support process.

Mindset and Behaviors

The organizational capability to manage the way people think, feel, and act in the workplace individually as well as collectively.  The target areas to focus on here include a compelling purpose, collaborative execution, up-to-date skills, drive to improve, and committed leadership.

Model Warehouse Implementation

Lean Warehousing Transformation necessitates developing a “Model Warehouse,” which presents facilities for supply chain people to practically experience state-of-the-art warehouse operations in a modern warehouse and shop-floor environment.  The Model Warehouse incorporates newest technology and systems, and offers real-life conditions for building capabilities—i.e., optimization of storage, pick and pack, and dispatch processes.  Newest technologies—e.g., Smart Glasses and HoloLenses—available at the facility help improve the performance of pickers significantly and execute multi-order picking efficiently.

Such a setting allows people to observe and analyze the performance of an exemplary warehouse and implement this knowledge at their own premises.  Leading organizations organize a week-long rigorous knowledge sharing workshop—in an experiential learning environment of a Model Warehouse—for their people to have a hands-on experience to learn Lean Warehousing, actual picking, packing, root cause analysis, and performance management.  The participants of the Model Warehouse Knowledge Sharing Workshop are excellent candidates for “change agents” to implement Lean Transformation.

Interested in learning more about Lean Warehousing, Model Warehouse Implementation, and Lean Warehousing Transformation?  You can download an editable PowerPoint on Lean Warehousing Transformation here on the Flevy documents marketplace.

Are you a Management Consultant?

You can download this and hundreds of other consulting frameworks and consulting training guides from the FlevyPro library.

Read more…

8028315852?profile=original

Gordon Moore, Intel co-founder, observed that the number of transistors in a dense integrated circuit doubles about every two years.  He projected that this rate of growth would continue for at least another decade.

His observation, termed the “Moore’s Law,” has correctly predicted the pace of innovation for several decades and guided strategic planning and research and development in the semiconductor industry.  Moore’s law is based on observation and projection of historical trends.

In 2015, Gordon Moore foresaw that the rate of progress would reach saturation.  In fact, semiconductor advancement has declined industry-wide since 2010, much lower than the pace predicted by Moore's law.  The doubling time and semi-conductor performance has changed, but it has not impacted the nature of the law much.

Although many people predict the demise of Moore’s law, exponential growth in computing power persists with the emergence of innovative technologies.  Moore’s law is only part of the equation for effective Digital Transformation—there are other contributing factors including the role of leadership.

First Law of Digital Transformation

George Westerman—a senior lecturer at the MIT Sloan School of Management—proposes a new law, which states that, “Technology changes quickly, but organizations change much more slowly.”  The law known as the “First Law of Digital Transformation” or “George’s Law” is a pretty straightforward observation, but is often ignored by the senior leadership.  This is why Digital Transformation is considered more of a leadership—than technical—issue.

Just announcing an organization-wide Transformation program does not change the enterprise.  According to George’s Law, successful Digital Transformation hinges on the abilities of senior leadership to effectively manage the so many contrasting mindsets of its workforce, identify and take care of the idiosyncrasies associated with these mindsets, interpret their desires, and focus attention on encouraging people to change.

Above all, the leadership should focus on converting Digital Transformation from a project to a critical capability.  This can be done by shifting emphasis from making a limited investment to establishing a sustainable culture of Digital Innovation Factory that concentrates on 3 core elements:

  1. Provide People with a Clear and Compelling Vision
  2. Invest in Upgrading or Replacing Legacy Technology Infrastructure
  3. Change the Way the Organization Collaborates

Let’s now discuss the first 2 elements of the First Law of Digital Transformation.

Provide People with a Clear and Compelling Vision

Without a clear and compelling transformative vision, organizations cannot gather people to support the change agenda.  People can be either change resisters, bystanders, or change enablers.  However, most people typically tend to like maintaining the status quo, ignore change, or choose to openly or covertly engage in a battle against it.

For the employees to embrace change, leadership needs to make them understand what’s in it for them during the transition and the future organizational state.  This necessitates the leaders to develop and share a compelling vision to help the people understand the rationale for change, make people visualize the positive outcomes they can achieve through Transformation, and what they can do to enable change.  A compelling vision even urges the people to recommend methods to turn the vision into reality.

Invest in Upgrading or Replacing Legacy Technology Infrastructure

Problems and shortcomings in the legacy platforms is an important area to focus on during Digital Transformation.  The legacy technology infrastructure, outdated systems, unorganized processes, and messy data are the main reasons for organizational lethargy.  These issues hinder the availability of a unified view of the customer, implementing data analytics, and add to significant costs in the way of executing Digital Transformation.

Successful Digital Innovation necessitates the organizations to invest in streamlining the legacy systems and setting up new technology platforms that are able to enable digital and link the legacy systems.  Fixing legacy platforms engenders leaner and faster business processes and helps in maintaining a steady momentum of Innovation.

Interested in learning more about the First Law of Digital Transformation?  You can download an editable PowerPoint on First Law of Digital Transformation here on the Flevy documents marketplace.

Are you a Management Consultant?

You can download this and hundreds of other consulting frameworks and consulting training guides from the FlevyPro library.

Read more…

Strategy Classic Series: Porter's Five Forces

8028310300?profile=original

Michael Eugene Porter—a Professor at the Institute for Strategy and Competitiveness, Harvard Business School—is widely acclaimed for his unmatched prowess in competitive strategy, strategic planning, global economic development, and the application of competitive principles and strategic approaches.  Renowned as the father of modern day strategy, Dr. Porter is an author of 18 books and a number of articles.

His scholarly writings on management and competitiveness are ranked as the most influential pieces of work till date.  Dr. Michael Porter is widely known for his Porter’s Five Forces framework, which is a useful tool to evaluate the competitiveness of an organization with respect to its rivals.  Competition is part and parcel of every industry, and for the existence of an enterprise it is important to know its rivals and how their product / service offerings and marketing strategies affect the market.  It is a common foundational framework used in Strategy Development.

The Five Forces framework emphasizes on 5 critical elements that determine the attractiveness of a business against its rivals in the industry:

  1. Threat of New Entrants
  2. Supplier Power
  3. Buyer Power
  4. Threat of Substitution
  5. Competitive Rivalry

Threat of New Entrants

This element examines the simplicity or complexity of an industry for the competitors to jump in.  High-return industries are more appealing to new entrants.  A market with easy access for new entrants poses greater risk—of market share diminishing—for established businesses.  New entrants in an industry are able to dent the profitability of established players unless the incumbents retaliate strongly and make the entry of new firms challenging.

A serious threat to entry also relies on the existing barriers in the industry.  If the market entry barriers are high and there is an expected sharp response from the entrenched competitors, the newcomers will think twice before entering the market.  Another important factor for new entrants is the requirement for large capital for branding, advertising and creating product demand, which limits their entry in a niche market.  Aspiring market entrants should thoroughly analyze and understand all the critical barriers to entry before entering an industry—such as economies of scale, product differentiation, capital investment, access to distribution channels, and government policies and regulations.

There 6 prevalent types of barriers to entry:

  1. Economics of scale
  2. Product differentiation
  3. Capital requirements
  4. Cost disadvantages (independent of size)
  5. Access to distribution channels
  6. Government / regulatory policy

Supplier Power

Suppliers are a powerful force that influences the competitiveness of an industry.  They create immense pressure on market players by slashing the quality of goods and by increasing prices, thereby squeezing the margins of manufacturers.  For instance, by jacking up the price of soft drink concentrate, suppliers erode profitability of bottling companies.  The bottlers, in turn, don’t have much leverage to raise their own prices because of intense competition from fruit drinks, powdered mixes, and other beverages.

The power of a supplier group amplifies if it’s dominated by a few firm, has differentiated and unique products; and has built up switching costs that buyers face when changing suppliers, for making investments in specialized equipment, or in learning how to operate a supplier’s equipment.  The supplier group also thrives when there isn’t much competition for sale to the industry, or when the industry is not its major customer, as this saves the supplier from selling at a bargain and investing in R&D and lobbying for the industry.

Buyer Power

Buyer or customer groups also impact the competitiveness of an industry landscape by exercising their power to bring the prices down, insist on higher quality, or demand more service.  A buyer group is powerful if it buys in large volumes in an industry characterized by heavy fixed costs and buys undifferentiated or standard products.  Buyers have the ability to put one supplier against another and find alternative suppliers.

The power of a buyer group increases if it’s a low profit business—providing it the reason to be price sensitive and insist on lower purchasing costs—, if the industry’s product is insignificant to the quality of the buyers’ products or services, or if the product that suppliers provide does not save much for the buyer.  Buyers can also use the threat of self-manufacturing as a bargaining lever against the suppliers.

Threat of Substitution

Substitute product or service offerings restrict the capacity of an industry by placing an upper limit on prices it can charge.  The industry’s earnings and profits will continue to suffer lest it can enhance the quality of products or create differentiation through, for instance, aggressive marketing.

If substitute products offer more competitive price-performance trade-off, then the industry’s profitability gets limited or goes down.  For instance, the erosion of profits for the sugar industry due to substitution of sugar with commercialized high-fructose corn syrup.

Internal Rivalry

Internal Rivalry, existing at the center of Porter's Five Forces framework, represents the competition between existing players often leads to rivals using manipulative tactics like price competition, new product launch, and advertising wars.  Companies can use strategic shifts to improve their competitive position—e.g., raising buyers’ switching costs, increasing differentiation, and focusing on low fixed costs areas.

Interested in learning more about the other critical elements of the Porter’s Five Forces and their role in in determining the state of competition and profit potential of an industry?  You can download an editable PowerPoint on Porter’s Five Forces here on the Flevy documents marketplace.

Are you a Management Consultant?

You can download this and hundreds of other consulting frameworks and consulting training guides from the FlevyPro library.

Read more…

8028309675?profile=original

Technology, Internet, growth, and globalization have metamorphosed the way we work, play, and live.  They have even changed the fundamental laws of economics.  We are living in an economy that is quite different from the old manufacturing-based economy of the 1980s.  Fewer people are now employed in the manufacturing sector, who are anxious about the prospects of being replaced by machines soon.

The “New Economy” is a term economists started using in the 1990s to describe new, high-tech, high-growth industries that have been the driving force of economic growth since that period.  The new economy is also heralded as the Digital Economy, the Knowledge Economy, the Data Economy, or the eCommerce Economy.  Top technology enterprises—including Google, Facebook and Apple—have outpaced traditional firms around the globe by taking advantage of the new economy.

Leadership Development in this age of Digital Economy is a key challenge for most organizations.  More and more organizations, today, are revisiting what they are about and the meaning of leadership for them.  It’s not about one person or even those residing at the top anymore.

MIT Sloan Management Review conducted a study of 4,000 executives from 120 geographies around the world to understand what defines a great leader in this changing world.  The study revealed striking results with most executives believed that their leaders lacked the mindset needed to produce the strategic changes essential for leading in the Digital Economy.  Enterprise-level transformation is what majority of leaders feared to embark on.

Mindsets are established set of attitudes held by someone that shape how a person interprets and responds to experiences.  A mindset arises out of a person's view of the world or philosophy of life.  To know about the Digital Economy leadership mindsets (i.e. leadership mindsets critical to survive in this new economy), the MIT Sloan Management Review’s global study identifies 4 critical mindsets—based on in-depth interviews from executives worldwide and detailed analysis of data:

  1. The Producer
  2. The Investor
  3. The Connector
  4. The Explorer

Let's define these first 2 leadership mindsets.

The Producer

Leaders with a producer mindset evaluate each of their customer touch points painstakingly.  These leaders exhibit a passion for producing customer value.  Producers concentrate on analytics, digital know-how, implementation, results, and customer satisfaction.  They focus on analytics to fast-track creativity.  The resulting innovation helps them tackle shifting customer preferences and enhance customer experiences.  The Producers strive to create all the customer journeys enjoyable.

The Investor

The leaders with an investor mindset make people appreciate the higher purpose they serve by their work.  They constantly struggle to instill motivation and teamwork among their teams in order to achieve their overall organizational goals.  The leaders with an investor mindset are concerned about the communities that surround them.  They look after the well-being and constant advancement of their employees, and devote their efforts to improve value for their customers.

Fostering these types of mindsets is critical to building the right Organizational Culture for an organization to be successful in the Digital Economy.

Interested in learning more about the leadership mindsets required to win in the new economy?  You can download an editable PowerPoint on Leadership Mindsets Critical to Succeed in the Digital Economy here on the Flevy documents marketplace.

Are you a Management Consultant?

You can download this and hundreds of other consulting frameworks and consulting training guides from the FlevyPro library.

Read more…

8028306092?profile=original

Technological innovation and intensifying competition are forcing leaders to rethink how they use Key Performance Indicators (KPIs) to manage and direct organizations.  Digitization has reinforced the importance of Key Performance Indicators not only in enhancing employee performance but driving the overall organizational productivity.

The role of KPIs is becoming more dynamic.  KPIs are getting demonstrably flexible, smarter, and valuable in achieving strategic advantage.  Leading technology-driven organizations—including Amazon, Airbnb, and Uber—rely on metrics considerably and utilize KPIs to steer their strategy and evaluate success.  They perceive KPIs quite differently than traditional-focused organizations, and employ them as an input for automation, and to guide, regulate, and improve their machine learning tools.

To make the most out of these dynamic and strategic KPIs of this Digital Age, leaders need to be more insightful and knowledgeable.  They should be able to thoroughly determine which KPIs to analyze, how to measure them, and how to effectively improve them.  Understanding the value of selected KPIs and their optimization is key to aligning strategies; making the right decision to invest in data, analytics, and automation capabilities; and create a link between people and machines.

KPI Virtuous Cycle

The relationships and dependencies that clarify, educate, and enhance KPI investment are demonstrated by “KPI Virtuous Cycle.”  By digitally linking KPIs, data, and decision-making into virtuous cycles, companies can align their immediate situational requirements with long-term strategic planning.  The KPI Virtuous Cycle has 3 key components, and it demands active cross-functional collaboration:

  1. Data Governance
  2. KPIs
  3. Decision Rights

The way these 3 components impact—and support each other—keeps changing.  Organizations aspiring to become digital-savvy should embrace, value, and relentlessly invest in the KPI Virtuous Cycle.

Data Governance

The first component of the KPI Virtuous Cycle is about employing authority and control (planning, monitoring, and enforcement) through a set of practices and processes to manage organizational data assets.  Leading digital organizations consider data as a strategic resource, a valuable tool for measurement and accountability, and a mechanism to facilitate meeting strategic KPIs.  Data Governance frameworks are guided by strategic KPIs.  Organizations should know what data sets would be ideal to predict and rank—for instance, customers’ lifetime value and their propensity to leave—to prioritize preemptive and preventive action.  Data and Analytics serve as a component of Data Governance.

Strategic KPIs

Strategic KPIs shape and govern enterprise Data Governance models.  These KPIs include financial, customer, supplier, channel, and partner performance parameters.  For instance, Data Governance initiatives in customer-centric organizations are prioritized to facilitate in realizing customer-focused KPIs—e.g., Net Promoter Score (NPS) and Customer Lifetime Value (CLV).  Enterprise Data Governance frameworks are strongly influenced and informed by strategic KPIs.

Decision Rights

Decision Rights ascertain the decision-making authority required to drive the business and strategic alignment.  Making decisions in such a way that it boosts organizational performance involves identifying the individuals explicitly involved in making decisions, charting an outline on how decisions will be made, reinforcing with appropriate processes and tools, and defining various decision rights scenarios to facilitate in automation.  It is, however, quite tricky to determine and assign decision rights when an enterprise is aspiring to empower its people and making machines function better.

Imperatives for Creating Dynamic and Strategic KPIs

For the KPIs to be strategically defined and become truly dynamic, the leadership needs to provide the required support by getting thorough data sets compiled and meaningful analytics performed.  At the same time, there is a need to:

  • Decide whether the decision rights needs to be assigned to individuals (rather than machines or vice versa.
  • Enhance the capabilities of people and machines.
  • Apply decision rights to generate data to identify and gauge productivity.
  • Identify the delays and bottlenecks between KPIs, data, and decisions.
  • Verify the diligence in the way KPIs, data, and decisions are mapped and monitored.

Interested in learning more about the components of KPI Virtuous Cycle, its applications, and Strategic KPIs?  You can download an editable PowerPoint on Strategic Key Performance Indicators (KPIs) here on the Flevy documents marketplace.

Are you a Management Consultant?

You can download this and hundreds of other consulting frameworks and consulting training guides from the FlevyPro library.

Read more…

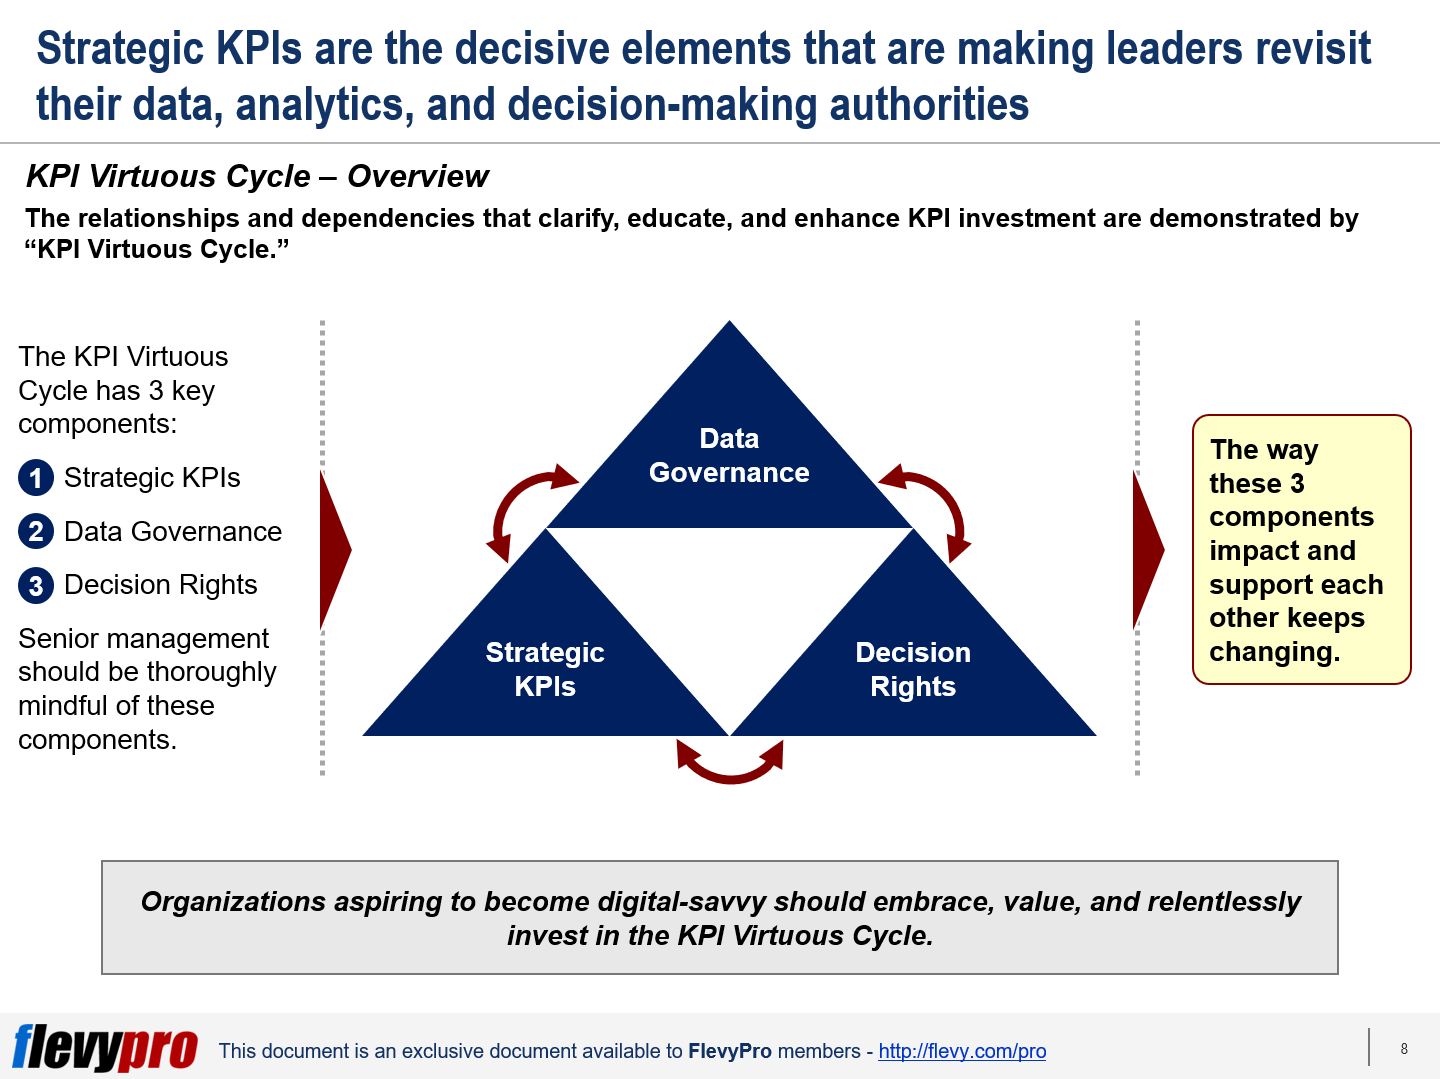
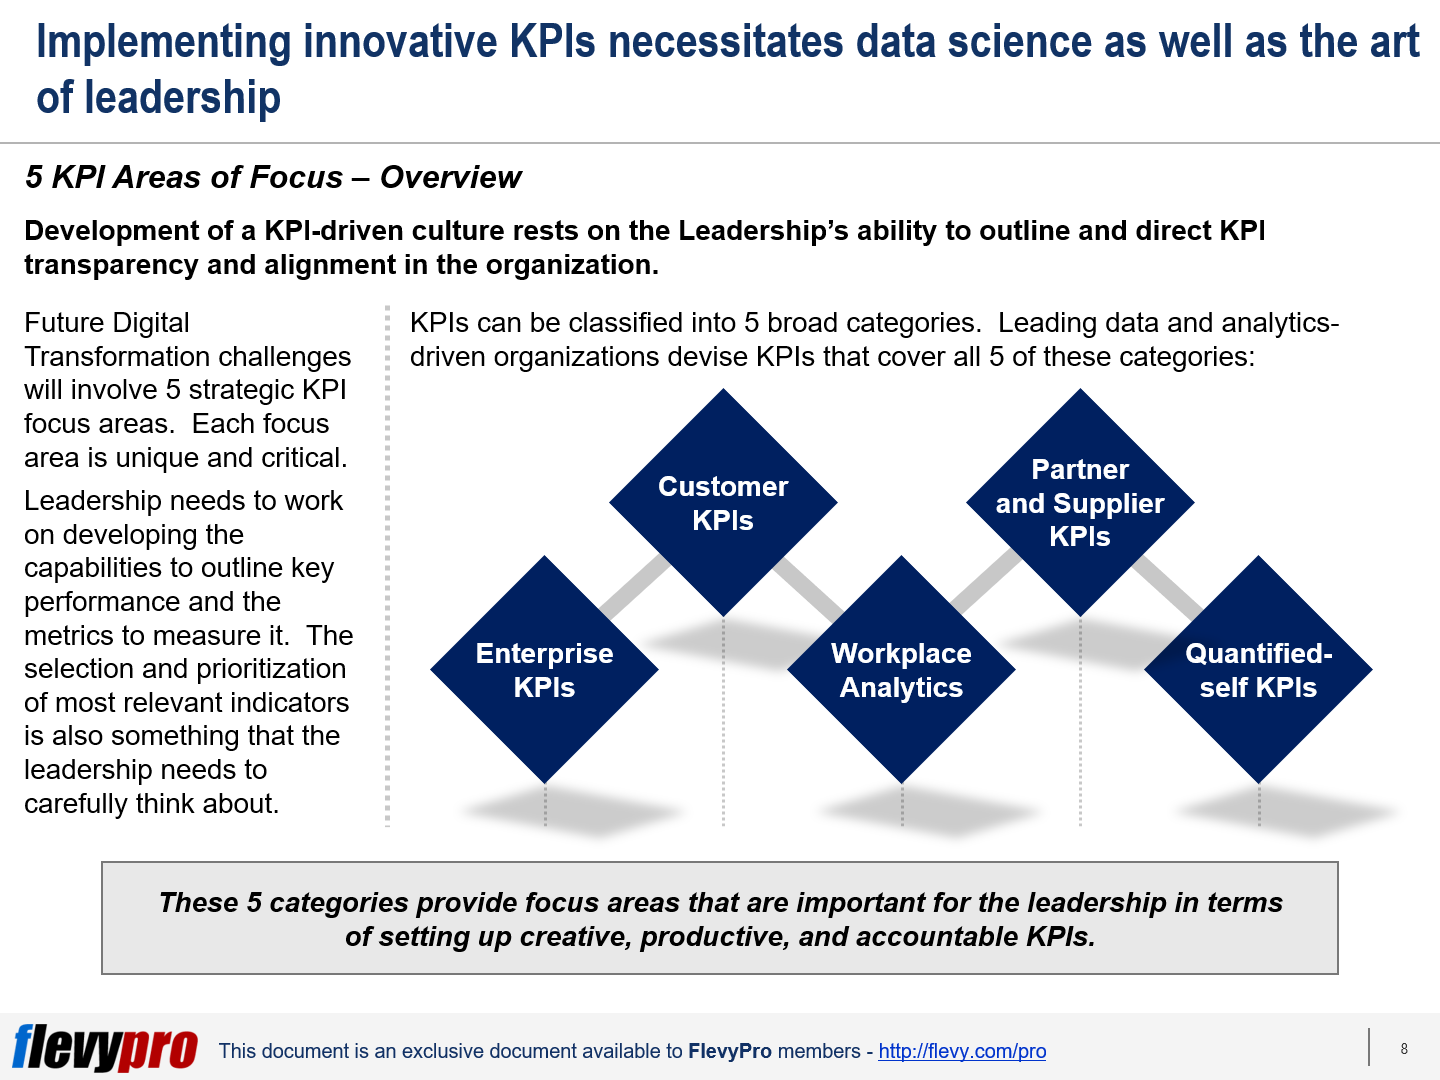
Creating a culture that measures productivity objectively is a sensitive matter. Key Performance Indicators (KPIs) are being employed extensively by organizations across the globe to monitor and track performance.  KPIs provide valuable metadata to improve top-down and bottom-up vertical efficiency.

Analytics-driven firms are aware that KPIs are much more than a tool to evaluate performance.  Utilizing KPIs, they gather valuable insights, create enterprise-wide accountability, and develop a goal-oriented culture.

However, most executives typically fall short of utilizing KPIs to their full potential.  They have to realize that the effectiveness of KPIs depends on two distinct yet important elements: KPI transparency for the entire workforce—making the core metrics available across the board at all levels—and alignment of KPIs—determining the KPIs most relevant to the people and organizational purpose, and taking action based on the results of performance monitoring.  Leading organizations share KPIs with all stakeholders and use algorithms to gauge the contribution of KPIs to critical functions, e.g., Marketing and Customer Experience.

To create an objective-driven culture, the senior leadership should work on developing capabilities to outline key performance and putting in place accurate metrics to measure it.  The selection and prioritization of most relevant indicators is something that the leadership needs to carefully think about.

When defining KPIs, there are 5 KPI focus areas.  Each focus area is unique and critical, but collectively they have a profound impact on each other and on the organizations that are aiming to undergo Digital Transformation.  Leading Data and Analytics-driven organizations devise KPIs that cover all 5 of these focus areas:

  1. Enterprise KPIs
  2. Customer KPIs
  3. Workplace Analytics
  4. Partner and Supplier KPIs
  5. Quantified-self KPIs

Let’s discuss the first 3 focus areas in detail, for now.

Enterprise KPIs

The Enterprise KPIs benchmark the effectiveness of core functions of an organization.  These indicators are important to determine the accountability of the leadership and workforce, and are vital for strategic as well as routine decision-making and investment.  Examples of these indicators include Risk-Adjusted Return On Capital (RAROC) and Net Promoter Score (NPS).

Customer KPIs

The Customer KPIs facilitate in measuring the knowledge and impact of all leads, prospects, and customers. These metrics are used to calculate the actual and likely financial contributions of business prospects and clients.  The Customer KPIs assist in analyzing and ranking the relationships that organizations aspire to develop with the customers and better understanding each segment and sales funnel the customers belong.  Customer lifetime value is an example of these indicators.

Workplace Analytics

The Workplace Analytics pertain to quantifying the efficiency and commitment level of organizational people.  These analytics are used to isolate leadership tools and methodologies helpful in enhancing customer focus, and capture and quantify process outcomes and outputs feeding organizational KPIs.  These metrics are valuable in measuring collaboration across the organization, gauging the proficiency of managers in motivating their teams, and highlighting the elements that demoralize people.

Interested in learning more about the 5 KPI areas of focus?  You can download an editable PowerPoint on Key Performance Indicators (KPIs): 5 Areas of Focus here on the Flevy documents marketplace.

Are you a Management Consultant?

You can download this and hundreds of other consulting frameworks and consulting training guides from the FlevyPro library.

Read more…

8028308088?profile=original

In the age of rapid technological progress, where Digital Transformation  has become pervasive, business applications are getting increasingly complex and interconnected.  The advancement in technology has also helped attackers get more aggressive and inflict more damage to IT systems and applications.  Application security tools and techniques are evolving too, yet most organizations still fall prey to vulnerabilities.  Cybersecurity has become a bigger threat than ever before.

The current application security methodologies mainly count on detecting weaknesses and correcting them.  Most organizations, primarily, rely on utilizing penetration testing or automated tools, at the most.  They ignore to concentrate on establishing strong defenses against threats, merely do patch work, and leave the weaknesses unguarded.  A small fraction implement threat modeling, security architecture, secure coding techniques, and security testing—but even they are typically unsure of how these approaches link with their strategic business objectives.

A few weaknesses constitute majority of break-ins--e.g., SQL injections and buffer overflows.  Major security threats and application vulnerabilities include compromised credentials, failure to patch promptly, SQL injections, and cross-site scripting.  A large number of security threats can be neutralized just by taking care of security hygiene.

Secure Software Development

State-of-the-art technology and best practices available today offer effective yet economical methods to prevent security breaches and threats.  These tools and practices work well without affecting the pace of delivery or straining the users unnecessarily.

Secure software development not only warrants analyzing the technology but also looking at the entire organization that creates the software—people, processes, tools, and culture.  Secure software development culture inspires security by promoting and improving communication, collaboration, and competition on security topics and rapidly evolving the competence to create available, survivable, defensible, secure, and resilient software.

Rugged Software and a Culture of Security

Rugged software, or Rugged DevOps, promotes developing secure and resilient software by embedding this practice into the culture of an organization.  A Rugged culture of security is more than just secure—secure is a state of affairs at a specific time whereas Rugged means staying ahead of threats over time.  The rugged code aligns with the organizational objectives and can cope with any challenges.  Rugged enterprises constantly tweak their code and their internal organization—including governance, architecture, infrastructure, and operations—to stay ahead of attacks.  All applications developed by “Rugged” organizations are well-secured against threats, are able to self-evaluate and distinguish ongoing attacks, report security statuses, and take action aptly.

Rugged software is a consequence of the efforts to rationalize and fortify security.  This is achieved by communicating the lessons learnt from experimentation, setting up stringent lines of defense, and adopting and sharing rigid safety procedures across the board.  Adopting Rugged software development practices across the enterprise help execute more applications promptly, improve security, and achieve cost savings across the software development life-cycle.  Rugged software development is cost efficient because of fewer labor and time requisites during the requirements, design, execution, testing, iteration, and training phases of the development life-cycle.

The following 10 guiding principles apply to all organizations aiming to develop a Rugged culture of security:

  1. Perpetual Attacks Anticipation
  2. Staying Informed
  3. Security Hygiene
  4. Continuous Improvement
  5. Zero-defect Approach
  6. Reusable Tools
  7. One Team
  8. Comprehensive Testing
  9. Threat Modeling
  10. Peer Reviews

Let’s discuss the first 5 principles for now.

Perpetual Attacks Anticipation

A Rugged software development organization anticipates nonstop vulnerabilities and attacks—deliberate or accidental.

Staying Informed

Rugged organizations appreciate staying informed about security issues and potential threats, seek recommendations from security specialists, and identify and update security policies and rules.

Security Hygiene

Rugged organizations take good care of their security hygiene by limiting the sharing of user accounts, carefully guarding the passwords and sensitive personal information.  They employ secure software practices.

Continuous Improvement

Continuous Improvement is the management principle foundational to Lean Management that should be embraced by all areas of an organization.  In case, sensitive information is left lying on somebody’s desk at night, Rugged organizations ensure that this does not recur in future and gathers feedback from the people who happen to notice it.

Zero-defect Approach

Rugged organizations leave no room to tolerate any known weaknesses.  An issue is resolved as soon as it is detected.

Interested in learning more about the guiding principles to develop a Rugged culture of security?  You can download an editable PowerPoint on the Culture of Security here on the Flevy documents marketplace.

Are you a Management Consultant?

You can download this and hundreds of other consulting frameworks and consulting training guides from the FlevyPro library.

Read more…

8028305456?profile=original

With startups ready to disrupt traditional players, established firms need to form an even stronger bond with their customers instead of waiting for customers to reach out to them.

The traditional Customer Experience model—referred to as the “acquire what we make” model—is characterized by occasional interaction between the companies and the customers, once a customer ascertains her/his needs and looks for products or services to fulfill them.  In this model, companies do all they can to offer quality products or services at a competitive price, while their marketing and operations are based only on brief engagement with the customers.  Because of the occasional connection with the customer in this approach, the vendor has little knowledge of the difficulties a customer faces to procure a product or service.

With each passing day the tactics that organizations use to connect with their customers are undergoing rapid transformation.  Technology and customized digital interactions provide companies the means to build deeper relationships with customers.  Organizations pursuing Customer-centric Design, today, are addressing customers’ needs the moment they occur—or even before that by virtue of “Connected Customer Strategies.”

Connected Customer Strategies call for the companies to maintain customer relationships round the clock (24x7).  These strategies demand from the organizations to develop an assortment of new capabilities (e.g., invest in Big data and Analytics), connect with the customers on a regular basis, track their activities, and offer customized experiences and offerings.  These strategies are not about using modern technology, rather the methods companies should adopt by using technology in creating delightful experiences and long-standing associations with the customers.

There are 4 distinct Connected Customer Strategies that are instrumental in developing exceptional Customer Journeys:

  1. Fast Response
  2. Personalized Recommendations
  3. Proactive Recommendations
  4. Automatic Execution

Let's discuss the first 2 strategies in detail now.

Fast Response

Organizational Leadership needs to carefully consider adopting the most suitable connected customer strategy.  The Fast Response strategy, as the name suggests, is about prompt and flawless delivery of required services and products to the customers.  To adopt Fast Response strategy, organizations need to ascertain the customer requirements carefully and simplify their purchasing process.

The core capabilities needed to implement this strategy include prompt delivery, minimal friction, flexibility, and precise execution.  This strategy is appropriate for knowledgeable yet authoritative customers who dislike disclosing their personal information.  Using this strategy, a prompt response to a customer needing replacement of a product should be a simple yet accurate, couple-of-click online ordering process and the order should be delivered a few hours later.  The aim of the Fast Response strategy is to reduce the amount of time and energy the customers spend on procurement as much as possible.

Personalized Recommendations

Organizations using Personalized Recommendations strategy help customers identify their needs by presenting various options to them.  The strategy involves active involvement of firms in assisting their customers by offering a menu of customized offerings—as soon as the customers have finalized their requirement but before their decision on how to fulfill it.

This strategy is suitable for customers who are willing to share their data with the company and value advice but still hold the final say.  With the Personalized Recommendations strategy at work, the journey for a customer needing a product replacement could simply involve the customer’s visiting a company’s website, automatic suggestions to customer about the correct product based on her/his prior shopping history, the customer ordering the suggested product, and receiving the delivery a few hours later.

Interested in learning more about the other Connected Customer Strategies?  You can download an editable PowerPoint on Customer Experience: Connected Customer Strategies here on the Flevy documents marketplace.

Are you a Management Consultant?

You can download this and hundreds of other consulting frameworks and consulting training guides from the FlevyPro library.

Read more…

8028309096?profile=original

Businesses are getting increasingly complex and so are customers’ expectations. Digital organizations are digitizing their critical Customer Journeys at scale to outperform competition. These organizations are using Digitization to create streamlined journeys, which result in more agile IT units, quick delivery of new products, and improved Customer Experiences and Engagement.

But before embarking on digitization and streamlining Customer Journeys, organizations need to transform their products, processes, legacy systems and technology, and culture to become truly digital businesses.

Streamlining multiple Customer Journeys concurrently requires integration of existing systems, building new capabilities, and deploying existing competences in a different way. Specifically, it entails embracing the following 5-phase Omni-channel Customer Journey Design approach that is critical for improving Customer Experiences and accomplishing higher Customer Engagement:


  1. Develop Enterprise Customer Experience Story
  2. Prioritize Technology Transformation Projects
  3. Develop a Flexible Ecosystem of Technologies and Platforms
  4. Adapt Principles of Strong, Agile, and Lean
  5. Be Adaptive in Performance Management


 0*0Zu4EcnVCveluqBo.png


Now, let’s talk about the first 3 phases of the Omni-channel Customer Journey Design approach.

Phase 1 — Develop Enterprise Customer Experience Story

Creating a Customer Experience Story calls for setting up a Customer Experience team. The Customer Experience team begins by identifying the critical factors and main concerns in their customer relationships. Around these themes, they, then, carefully outline the experiences customers may come across during each and every interaction they have with the company in the form of a story. The Enterprise Customer Experience Story is unique to every company and provides a summary of the strategy, brand, and positioning in workable terms.

Next, the team identifies the journeys that are able to effectively deliver the factors and features critical for the customers utilizing digitization. Each journey should be critically analyzed to assess its significance, cost advantages associated with scaling it, the governance and technical impediments, and the availability of adequate financial and leadership resources to manage it. Thorough analysis of Customer Journeys yields a plan of action that aids in creating prioritized journeys.

Phase 2 — Prioritize Technology Transformation Projects

IT Transformation is typically the most challenging and resource hungry among other change initiatives. For instance, designing a mobile app is simple, however, it’s the linkage of the app to all the channels customers use and its integration with the back-end systems that is complicated.

To undertake Digitization, companies should avoid digitizing each journey separately — as it fosters internal silos — and investing heavily in Internet or mobile-channel IT. A better approach for the organizations is to rather prioritize the IT initiatives to enable smooth transformation of IT architecture with the addition of more customer journeys. Standard IT components are reusable across different journeys.

Phase 3 — Develop a Flexible Ecosystem of Technologies and Platforms

An important consideration for digitizing core journeys and scaling digitization is to link your IT systems with the technologies and platforms working outside the firm. These external systems provide the organization several advantages, including quick access to new customers, data pools, and capabilities.

Next-generation integration architecture should be designed in such a way that it should support open standards, dynamic interaction models, and curtail security threats. Progress in cloud computing and technology infrastructure has made quick and easy access, management, and operations of infrastructure resources possible — including networks, servers, databases, programs, and services. The skills needed to manage these technology ecosystems include DevOps experts to supervise integration of development and operations, enterprise architects, cloud engineers to manage software and cloud-computing, data scientists, and automation engineers.

Interested in learning more about the other key phases of the Customer Journey Design approach? You can download an editable PowerPoint on Omni-channel Customer Journey here on the Flevy documents marketplace.

Are you a Management Consultant?

You can download this and hundreds of other consulting frameworks and consulting training guides from the FlevyPro library.

Read more…
lead